
|
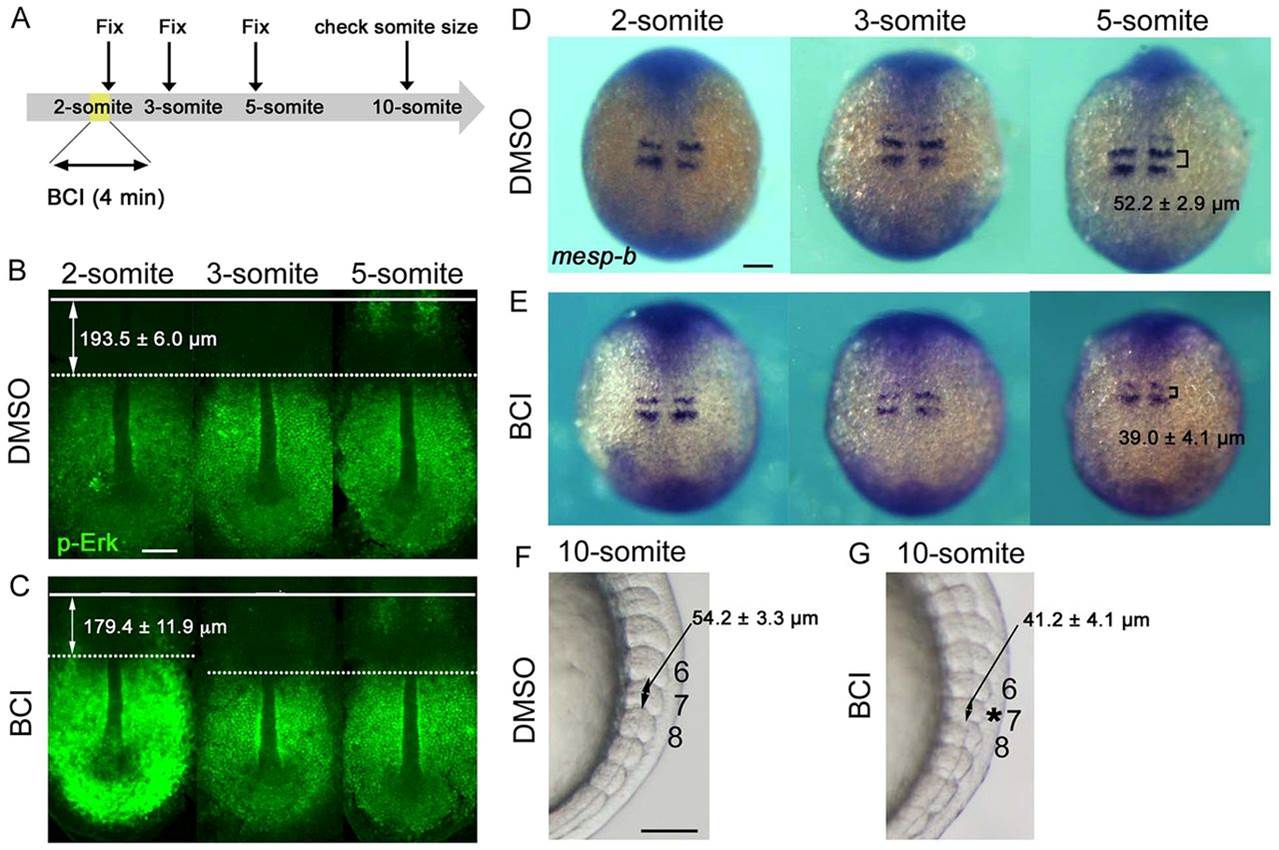
Fig. 3
The anterior limit of Erk activity marks the future somite boundary at B-5. (A) Schematic of the experimental design. (B,C) Representative images of p-Erk distribution in 2-, 3- and 5-somite-stage embryos treated with DMSO (vehicle; B) or BCI (C). The B-1 position is marked by a white line. The anterior limit of Erk activity is indicated by a white dotted line. In BCI-treated embryos, p-Erk signals were highly activated and expanded to the anterior only at the 2-somite stage (C). (D,E) Representative images of mesp-b expression in 2-, 3- and 5-somite stage embryos treated with DMSO (D) or BCI (E). Although p-Erk signals were altered immediately after BCI treatment (C), mesp-b expression changed only in S-I (brackets) of 5-somite stage embryos, which would generate a smaller 7th somite as shown in G. (F,G) Representative images of 10-somite-stage embryos treated with DMSO (F) or BCI (G). BSI treatment at the 2-somite stage led to decreased size of 7th somite (G). Scale bars: 100 µm.