
Image
|
Figure Caption
Fig. S6
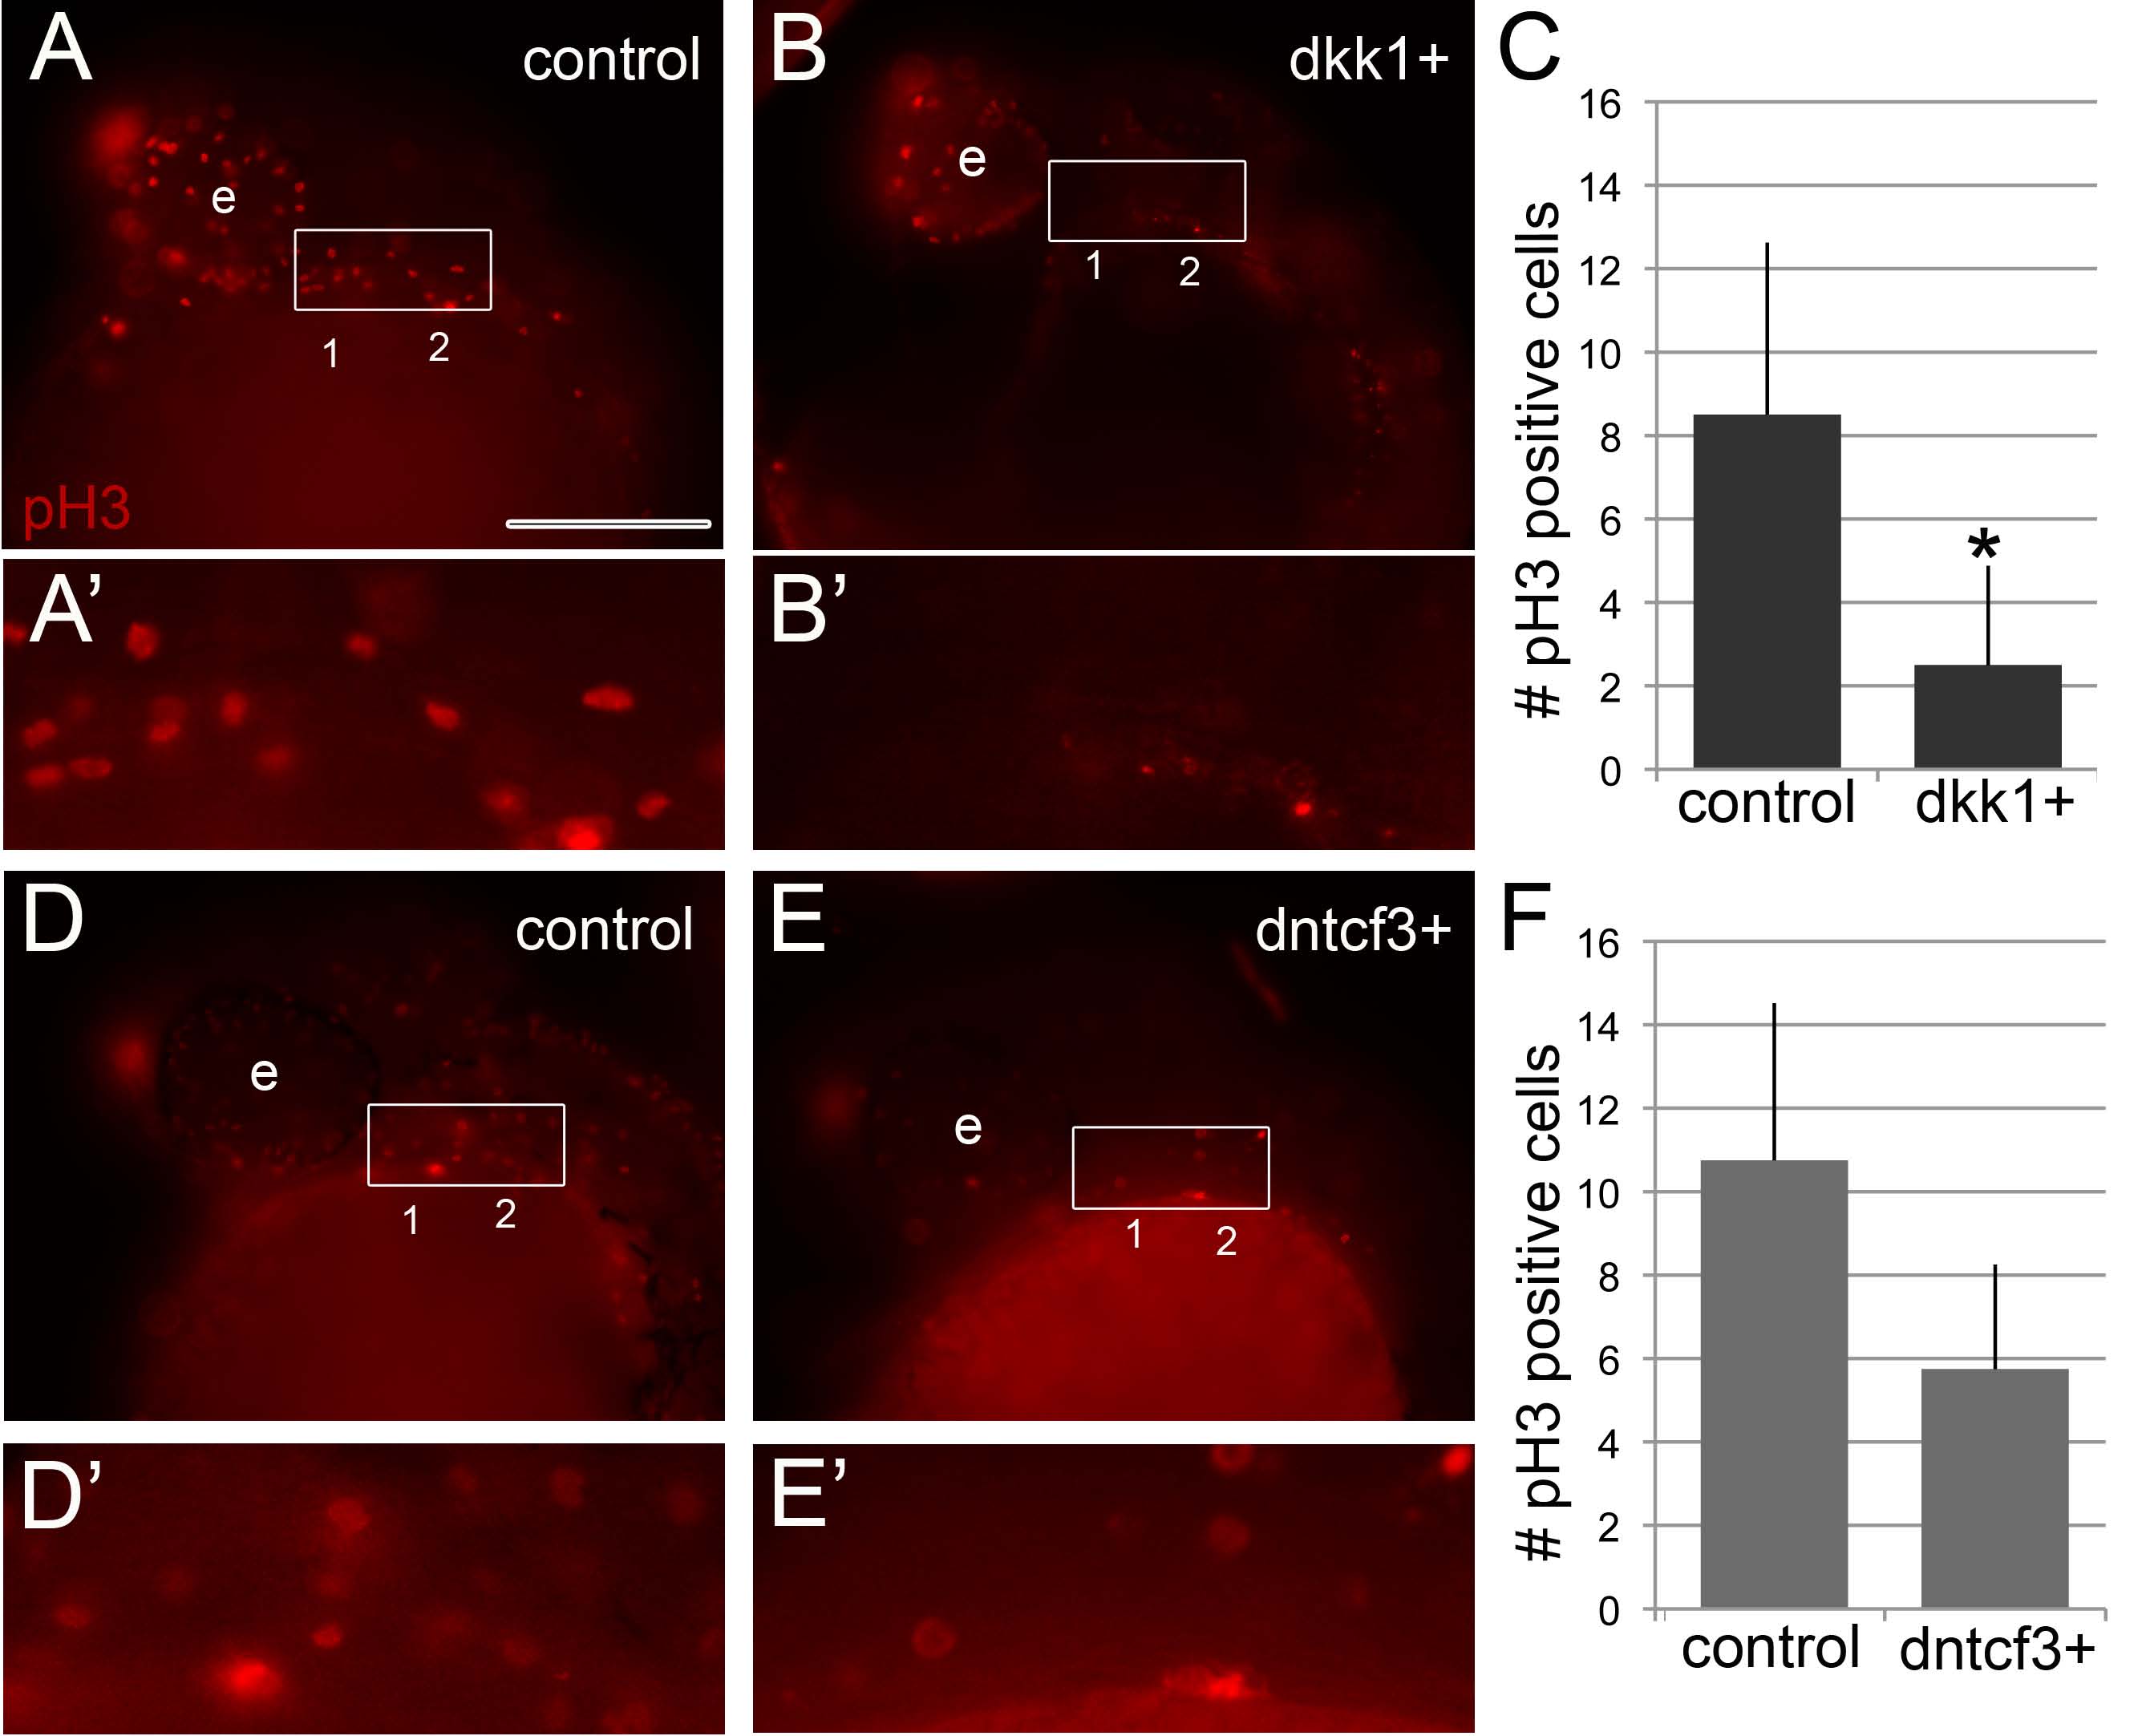
Arch proliferation defects in dkk1+ and dntcf3+ embryos. (A, B, D, E) Anti-phosphoHistone3 (pH 3) staining in controls (A, A′) and dkk1+ (B, B′) embryos stained 3 hphs and in controls (D, D′) and dntcf3+ (E, E′) embryos stained 4 hphs; lateral views, anterior to the left. (A′, B′, D′, E′). Enlargements of boxed areas encompassing presumptive first and second arches used for quantification. (C, F) Histograms quantifying numbers of pH 3 positive cells in the pharyngeal region of control and dkk1+ embryos, p<0.05 (C) and dntcf3+ embryos, p = 0.06 (F). Scale bar: 100 µm.
Acknowledgments
This image is the copyrighted work of the attributed author or publisher, and
ZFIN has permission only to display this image to its users.
Additional permissions should be obtained from the applicable author or publisher of the image.
Full text @ PLoS Genet.