
|
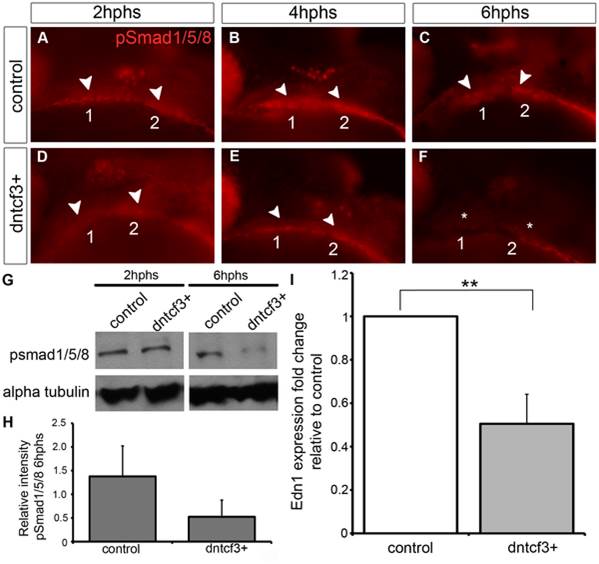
Fig. 5
Wnt signaling regulates Bmp and Edn1 signaling in the arches.
(A–F) Anti-pSmad1/5/8 staining in control (A–C) and dntcf3+ (D–F) embryos heat shocked at 22–24 hpf, lateral views, anterior to the left. pSmad1/5/8 expression is localized ventrally in the arches (arrowheads), reduced at 2 hphs (D), severely reduced at 4 hphs (E), and absent (asterisk) by 6 hphs (F). (G) Western blot analysis of anti-pSmad1/5/8 in control and dntcf3+ embryos. Protein was extracted at 2 hphs or 6 hphs and alpha tubulin was used as a loading control. (H) Histogram quantifying pSmad1/5/8 expression at 6 hphs, based on Western blots, in control and dntcf3+ embryos, levels normalized to alpha tubulin. (I) Histogram quantifying Edn1 expression by qPCR, in control and dntcf3+ embryos, p<0.01.