
Image
|
Figure Caption
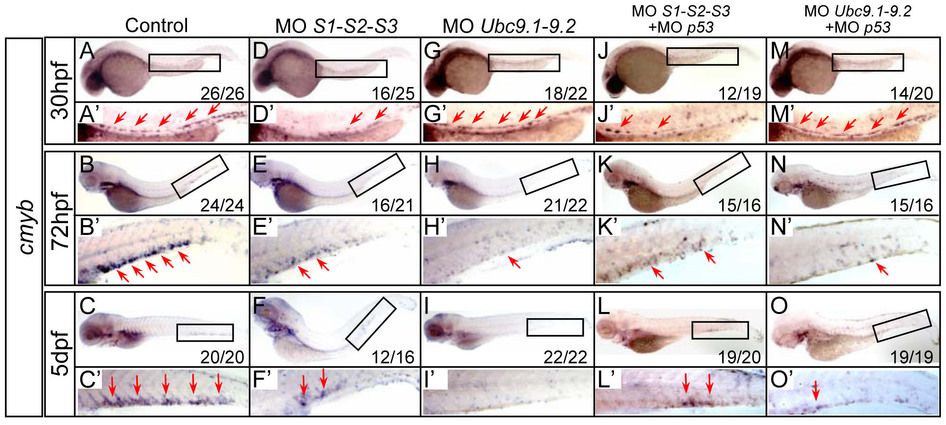
Fig. 1
HSPCs are depleted in SUMO-deficient embryos.
(A–O) WISH assay of cmyb at 30 hpf (A, D, G, J, M), 72 hpf (B, E, H, K, N) and 5 dpf (C, F, I, L, O). Boxed regions indicate the AGM or CHT, respectively. (A2–O2) Magnified images of corresponding boxed regions from A to O, respectively. Red arrows identify cmyb-positive cells in the AGM or CHT, respectively. MO, morpholino oligonucleotides.
Figure Data
Acknowledgments
This image is the copyrighted work of the attributed author or publisher, and
ZFIN has permission only to display this image to its users.
Additional permissions should be obtained from the applicable author or publisher of the image.
Full text @ Sci. Rep.