
Image
|
Figure Caption
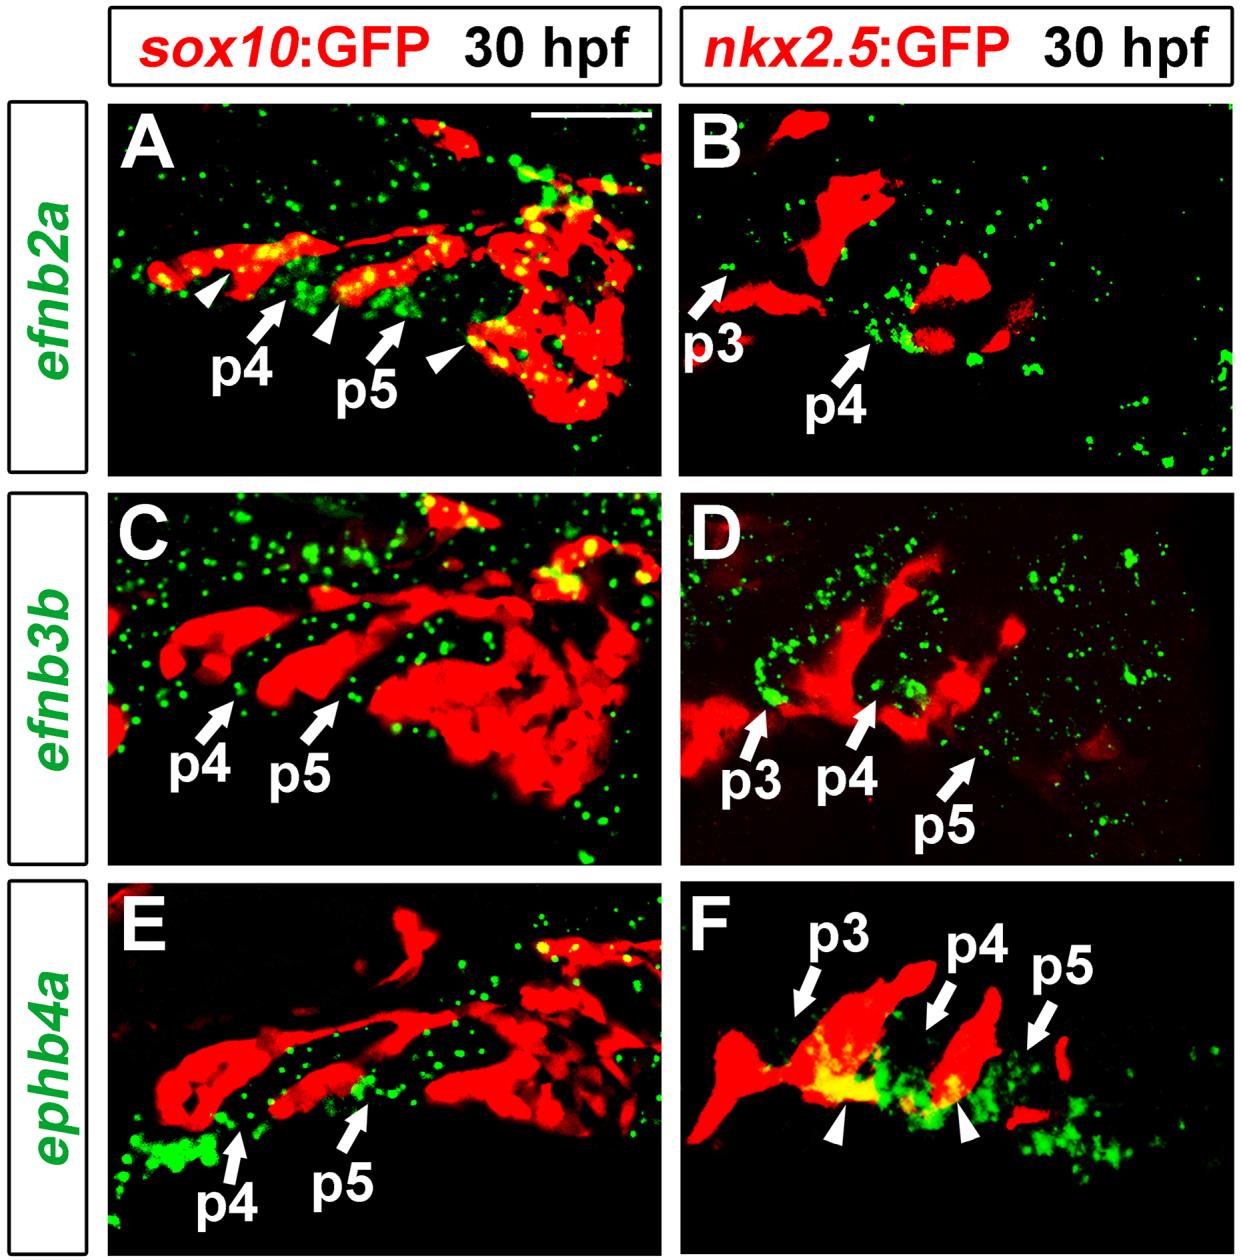
Fig. S1 Eph-ephrin gene expression within the 30-hpf zebrafish head. Fluorescent in situ hybridization (green) shows expression of efnb2a (A,B), efnb3b (C,D) and ephb4a (E,F) relative to sox10:GFP+ neural crest-derived mesenchyme (red in A,C,E) and nkx2.5:GFP+ mesoderm (red in B,D,F). In addition to staining in pouches p3, p4 and p5, we also observed expression of efnb2a in neural crest-derived cells (arrowheads in A) and ephb4a expression in ventral arch mesoderm (arrowheads in F) adjacent to more mature pouches. Scale bar: 20 µm.
Acknowledgments
This image is the copyrighted work of the attributed author or publisher, and
ZFIN has permission only to display this image to its users.
Additional permissions should be obtained from the applicable author or publisher of the image.
Full text @ Development