
Image
|
Figure Caption
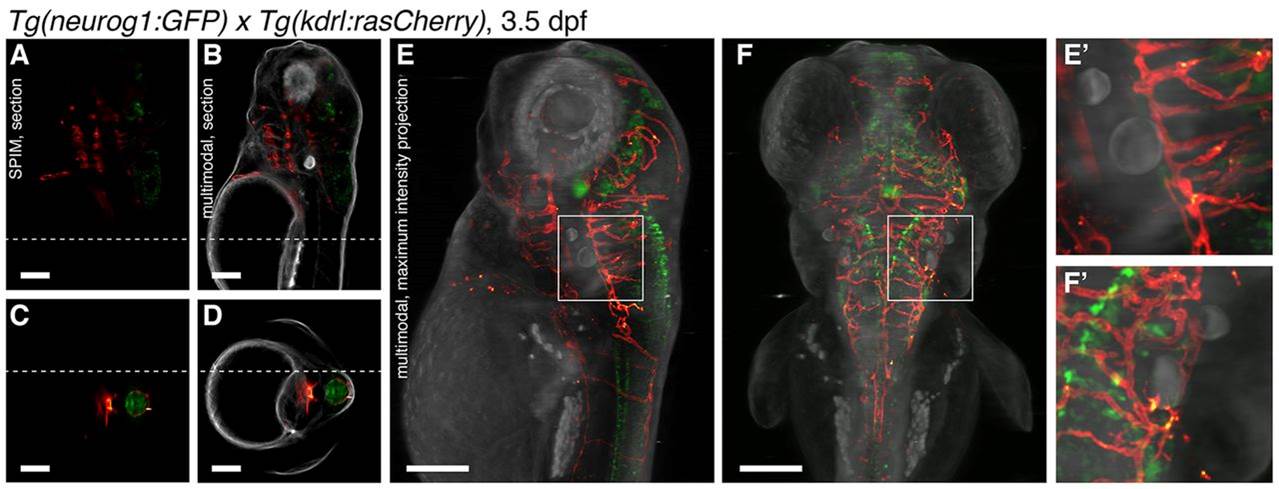
Fig. 2 Multimodal imaging. (A-D) Sagittal (A,B) or transverse (C,D) slice of a transgenic Tg(neurog1:GFP)×Tg(kdrl:rasCherry) zebrafish (3.5dpf) visualized with (A,C) SPIM or (B,D) SPIM (red/green) combined with optical tomography (gray). The dotted lines in the sagittal sections indicate the position of the transverse section and vice versa. (E-F′) Lateral (E) and dorsal (F) views of the sample created with weighted intensity projection. The boxed regions in E,F are enlarged in E′,F′ to illustrate the fine details in the data. Scale bars: 100µm.
Acknowledgments
This image is the copyrighted work of the attributed author or publisher, and
ZFIN has permission only to display this image to its users.
Additional permissions should be obtained from the applicable author or publisher of the image.
Full text @ Development