
|
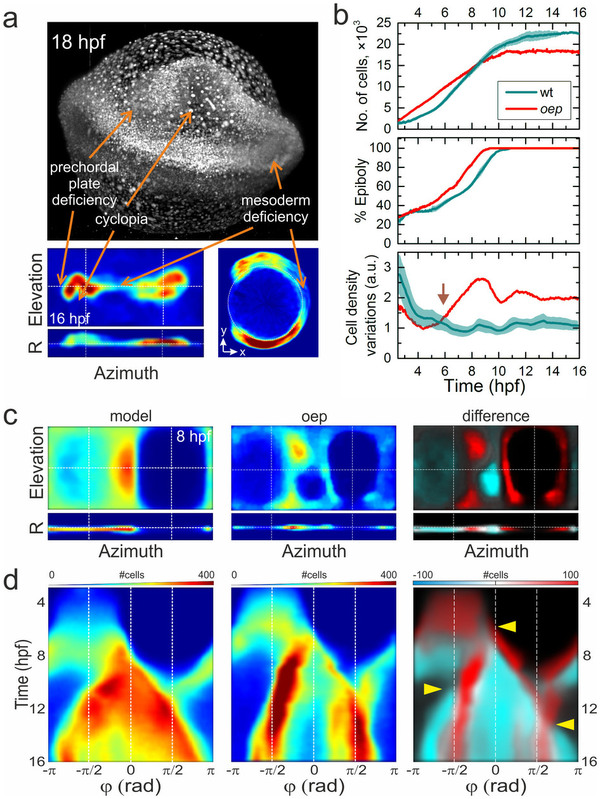
Fig. 5
Morphological changes of an oep mutant.
(a) MIP image of an oep mutant embryo at 18hpf and cell density projection at 16hpf. Arrows indicate characteristic phenotypical oep features. (b) Quantitative comparison of wt and oep mutant cell number (top), epiboly (middle), and cell density variation during development (bottom). Data of the wt embryo (Fig. 3F and Supplementary Fig. 3) are included for comparison. (c) Left and middle panels: Cell density projections at 8hpf of the averaged model and the individual oep mutant, respectively, depicted in the same color code as in Fig. 3a. Right panel: Overlay of differences (negative: cyan, positive: red) in cell densities between the mutant and the wt model on top of the model data (gray). (d) Kymographs of azimuthal projections, panels arranged as in (c). Arrows point to pronounced developmental differences between the oep mutant and the wt embryo model.