
|
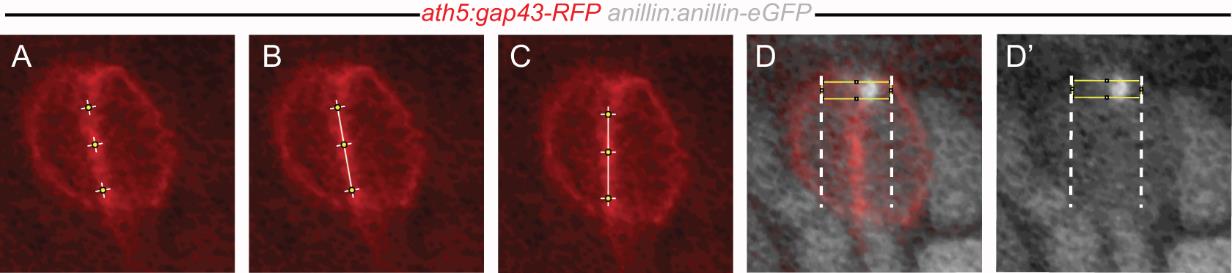
Fig. S3 Image-based detection of the Anillin and F-actin patch offset from the cell boundary (see also Fig. 1E,E′). (A-C) Images were rotated to reorient the daughter cell boundary vertically. (A) First, snapshots of frontal z-levels across the centre of the dividing daughters were obtained using the 3D slicing mode from the Volocity software (PerkinElmer). To find the best possible frontal z-slice, membrane and/or histone-tagged fluorescent protein fusions were used as reference. A division of an anillin:anillin-eGFP/ath5:gap43-eGFP expressing cell is shown as example (see also Fig. 1E,E′ and 2B). Next, the daughter cell interface was assessed by determining the maximum intensity of the membrane-tagged gap43-RFP (or lyn-mCherry for the F-actin) in three points along the apical to basal cell body axis. (B) The boundary was estimated by fitting a line through the three intensity maxima and (C) a rotation was applied to obtain a vertically oriented line. The position of the Anillin or F-actin centre of mass was determined by the maximum of the intensity profile from the Anillin (black data points in Fig. 1E,E′) or F-actin channel using the “plot profile” tool in Fiji. Values of associated Gaussian (black curve in Fig. 1A) were obtained using the “curve fitting” tool. (D) To calculate and normalize the offset of the Anillin spot from the cell boundary, the region of interest was centred on the vertical daughter cell boundary and extended to both outer cell membranes at the same latitude of the Anillin spot. (D′) The position of the Anillin centre of mass was determined by the maximum of the intensity profile from the Anillin channel. For each dividing daughters, the distance between the calculated maximum intensity value for membrane (daughter cell boundary) (red curve in Fig. 1E,E′) and the Anillin or F-actin centre of mass (black curve in Fig. 1E,E′) was determined. Plots representing the position of the Anillin or F-actin spot at the apical surface (Fig. 1F and Fig. 2C) were obtained and normalized between 0 (daughter cell boundary) and 100% (outer cell boundary). A distance from the cell boundary larger than the average radius of the Anillin or F-actin spot was used to define asymmetric positioning.