
|
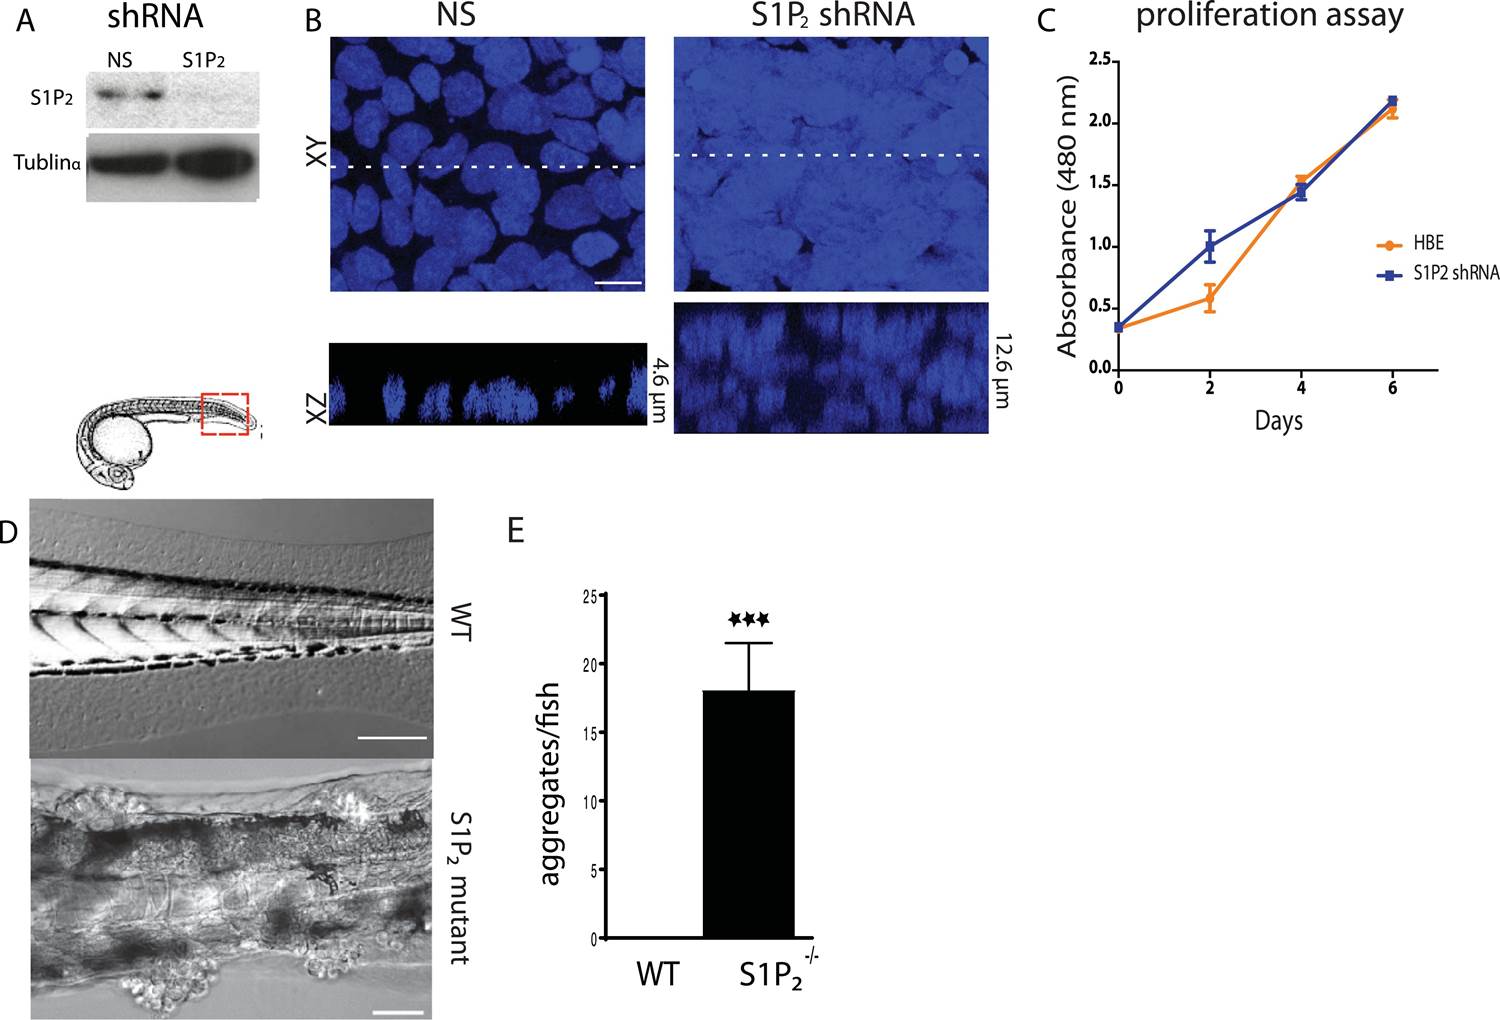
Fig. 1
(A) S1P2 immunoblot of HBE cells expressing control (left) or S1P2-specific shRNA (right) with α-tubulin as loading control. (B) Representative images of HBE cells (DNA only) expressing control (left) or S1P2-specific shRNA (right) grown for 3 weeks. Scale bar, 10 µm. (C) Proliferation assay indicates that S1P2-knockdown cells proliferate at the same rate as wild type controls cells. (D) Representative DIC micrographs of 5-dpf WT (top) and Mil (S1P2 mutant) (bottom) zebrafish larvae, where cartoon shows region where fish was imaged. Scale bars, 100 µm where red box indicates region imaged. (E) Quantification of epidermal clumps of 22 zebrafish larvae.