
|
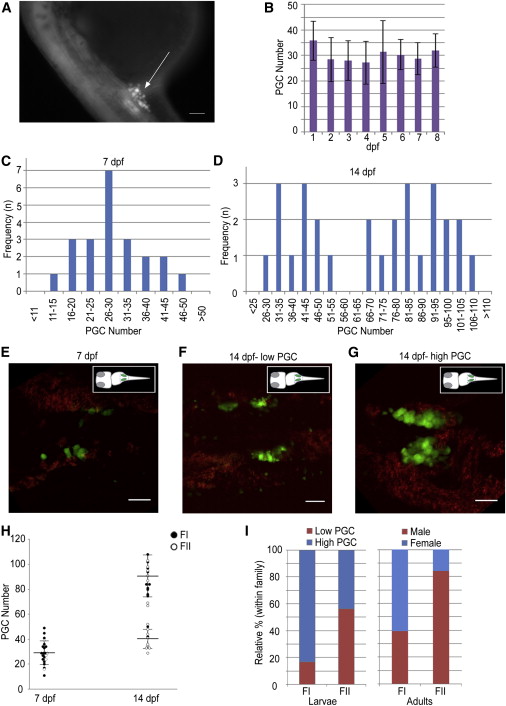
Fig. 1
Dimorphic Proliferation of PGCs Happens during the Second Week in the Larval Gonads of the Zebrafish
(A) A 24 hpf embryo of the Tg(vasa:vasa-EGFP) transgenic line. The GFP (+) germ cells cluster around anterior part of the yolk extension (arrow). The scale bar represents 100 µm.
(B) The PGC number in the first 8 days of development counted using the squash method. Image and PGC counts obtained using a compound epifluorescence microscope (n = 10, 10, 12, 6, 5, 3, 4, and 3 at 1–8 dpf, respectively). The mean ± SD is shown.
(C and D) Frequency distribution of PGC number at (C) 7 dpf (n = 22) and (D) 14 dpf (n = 28), showing unimodal and bimodal distributions, respectively.
(E–G) Trunk regions of the Tg(vasa:vasa-EGFP) line, showing different PGC distributions at 7 and 14 dpf. Images are average intensity projections of confocal z stacks showing GFP (+) cells (green) and background autofluorescence (red). Scale bars represent 50 µm.
(H) Density dot plot showing changes in the PGC number during development between different mating pairs (FI, closed circles; FII, open circles) at 7 and 14 dpf. Large horizontal bars indicate mean; smaller flanking bars indicate SD.
(I) Relative percentages of individuals in low (<60, red) and high (>65, blue) PGC number groups within families (FI, n = 12; FII, n = 16) at 14 dpf (left) and the respective progeny sex ratios (male, red; female, blue; FI, n = 194; FII, n = 138).