
|
Fig. S6
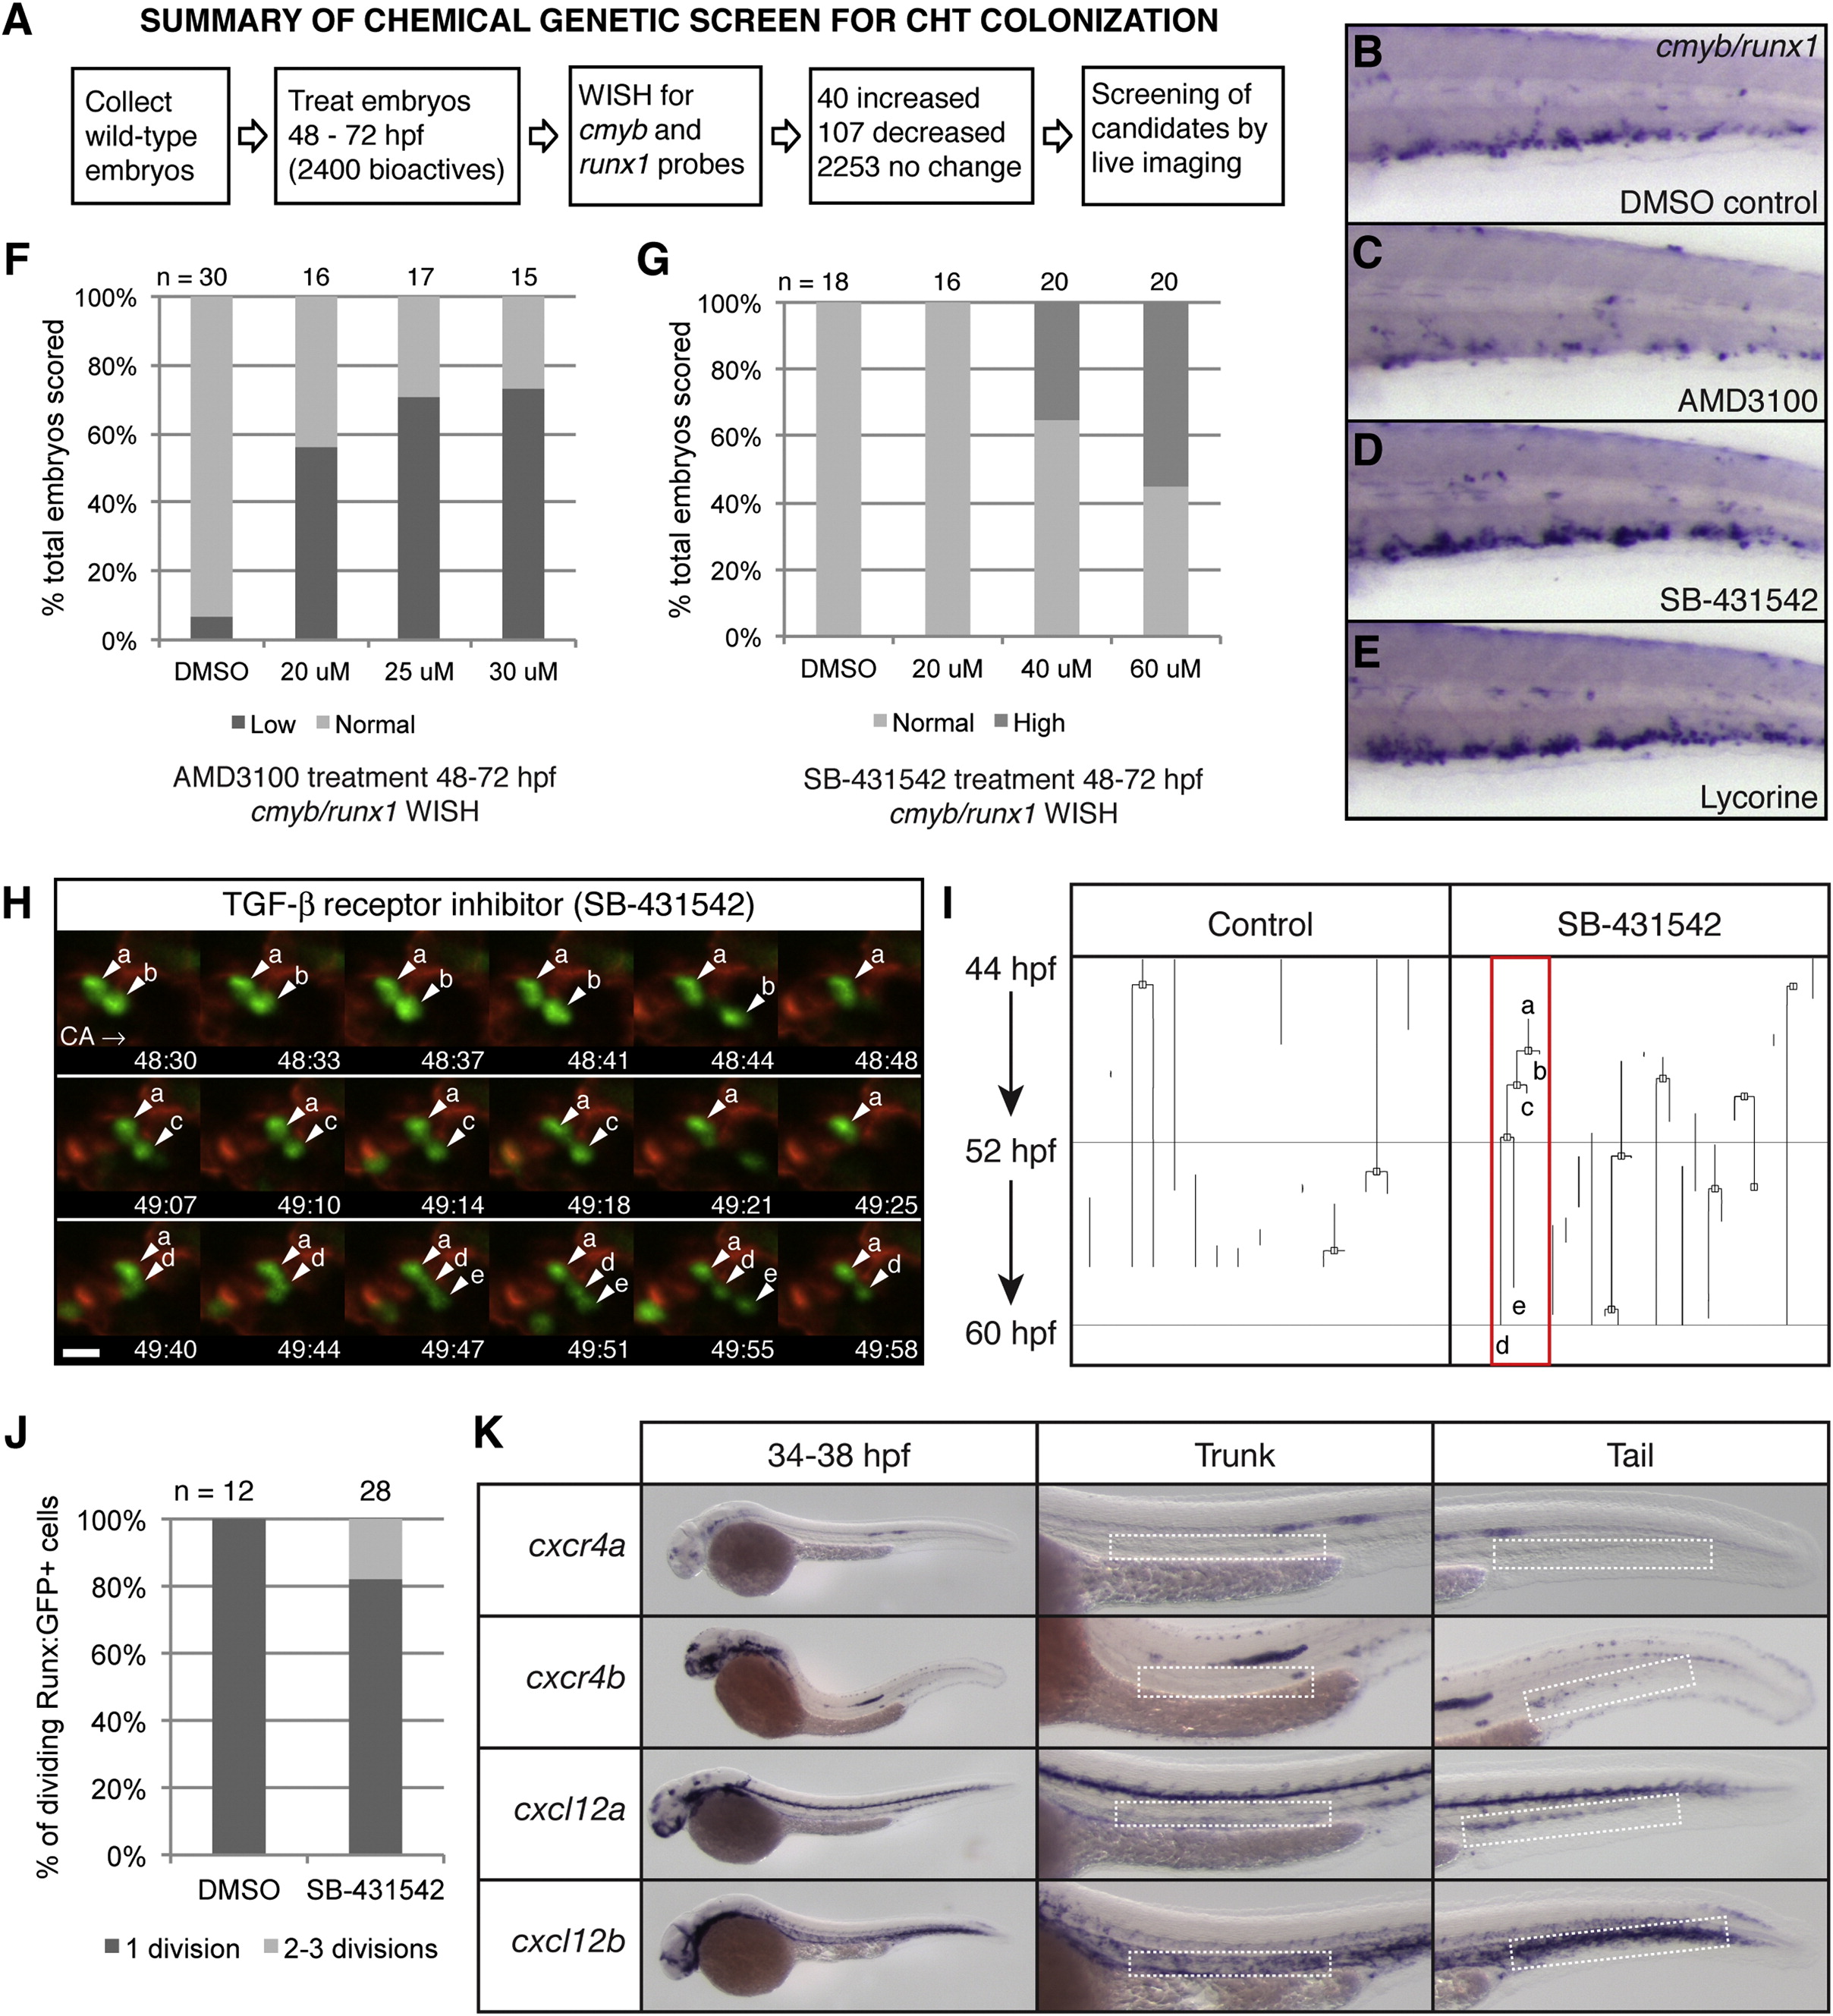
Chemical Genetic Screen to Identify Small-Molecule Regulators of CHT Niche Colonization, Related to Figure 7
(A) Overview of chemical screen.
(B–E) whole mount in situ hybridization (WISH) of cmyb/runx1 probes in the CHT of 72 hpf embryos. Treatments from 48-72 hpf as indicated. (B) DMSO control with normal expression.
(C–E) (C) Low expression after 25 µM AMD3100 treatment. High expression after treatment with (D) 40 µM SB-431542 or (E) 25 µM lycorine.
(F and G) Wild-type AB embryos were treated from 48-72 hpf and scored as in (B-D). The percentage of total is shown. Number of embryos scored at top.
(F) Dose-dependent decrease in cmyb/runx1 expression levels with increasing concentrations of CXCR4 antagonist AMD3100. The linear regression of Y (response) on X (dose) is significant: r2 = 0.3567, p = 7.84E-9.
(G) Dose-dependent increase in cmyb/runx1 expression levels with increasing concentrations of TGF-β inhibitor, SB-431542. The linear regression of Y (response) on X (dose) is significant: r2 = 0.275081, p = 1.61E-6.
(H) Selected frames from time-lapse movie of a Runx:GFP;kdrl:RFP double transgenic embryo treated with TGF-β inhibitor, SB-431542. In < 90 min, an HSPC (a) undergoes rounds of division and releases daughter cells (b,c,e) into circulation (daughter cell (d) was not released by the end of the movie; caudal artery, CA; circulation to posterior, right). Scale bar: 10 µm.
(I) Lineage tree analysis of HSPCs tracked in parallel time-lapse movies, with and without SB-431542 treatment, from 44-60 hpf. One line is one continuously tracked HSPC from the time it enters the CHT field of view until it exits. Branch points mark clear cell divisions. The red box marks the lineage of the cells shown in (H).
(J) Results from cell divisions scored in Runx:GFP+ time-lapse movies with DMSO or SB-431542 treatment, from 44-60 hpf. The percentage of total dividing cells scored. Total number of dividing cells scored at the top. Data collected from Runx:GFP+ time-lapse movies: DMSO treatment (11 embryos imaged; 42 Runx:GFP+ cells scored; 12/42 cells dividing; 0/12 cells dividing 2-3 times); SB-431542 treatment (15 embryos imaged; 79 Runx:GFP+ cells scored; 28/79 cells dividing; 5/28 cells dividing 2-3 times).
(K) Whole mount in situ expression patterns of cxcr4a, cxcr4b, cxcl12a, and cxcl12b (stages range between 34-38 hpf). For each example a detail of the trunk and tail is shown, with the dorsal aorta and CHT, respectively, marked with dashed white boxes. All genes are expressed in the head and lateral line. cxcr4b but not cxcr4a is expressed in the CHT. cxcl12a and cxcl12b are expressed in the dorsal aorta and CHT.
Reprinted from Cell, 160, Tamplin, O.J., Durand, E.M., Carr, L.A., Childs, S.J., Hagedorn, E.J., Li, P., Yzaguirre, A.D., Speck, N.A., Zon, L.I., Hematopoietic Stem Cell Arrival Triggers Dynamic Remodeling of the Perivascular Niche, 241-252, Copyright (2015) with permission from Elsevier. Full text @ Cell