
|
Fig. S1
Epithelial Properties of the Pre-EVL Surface Layer and Imaging, Related to Figure 1
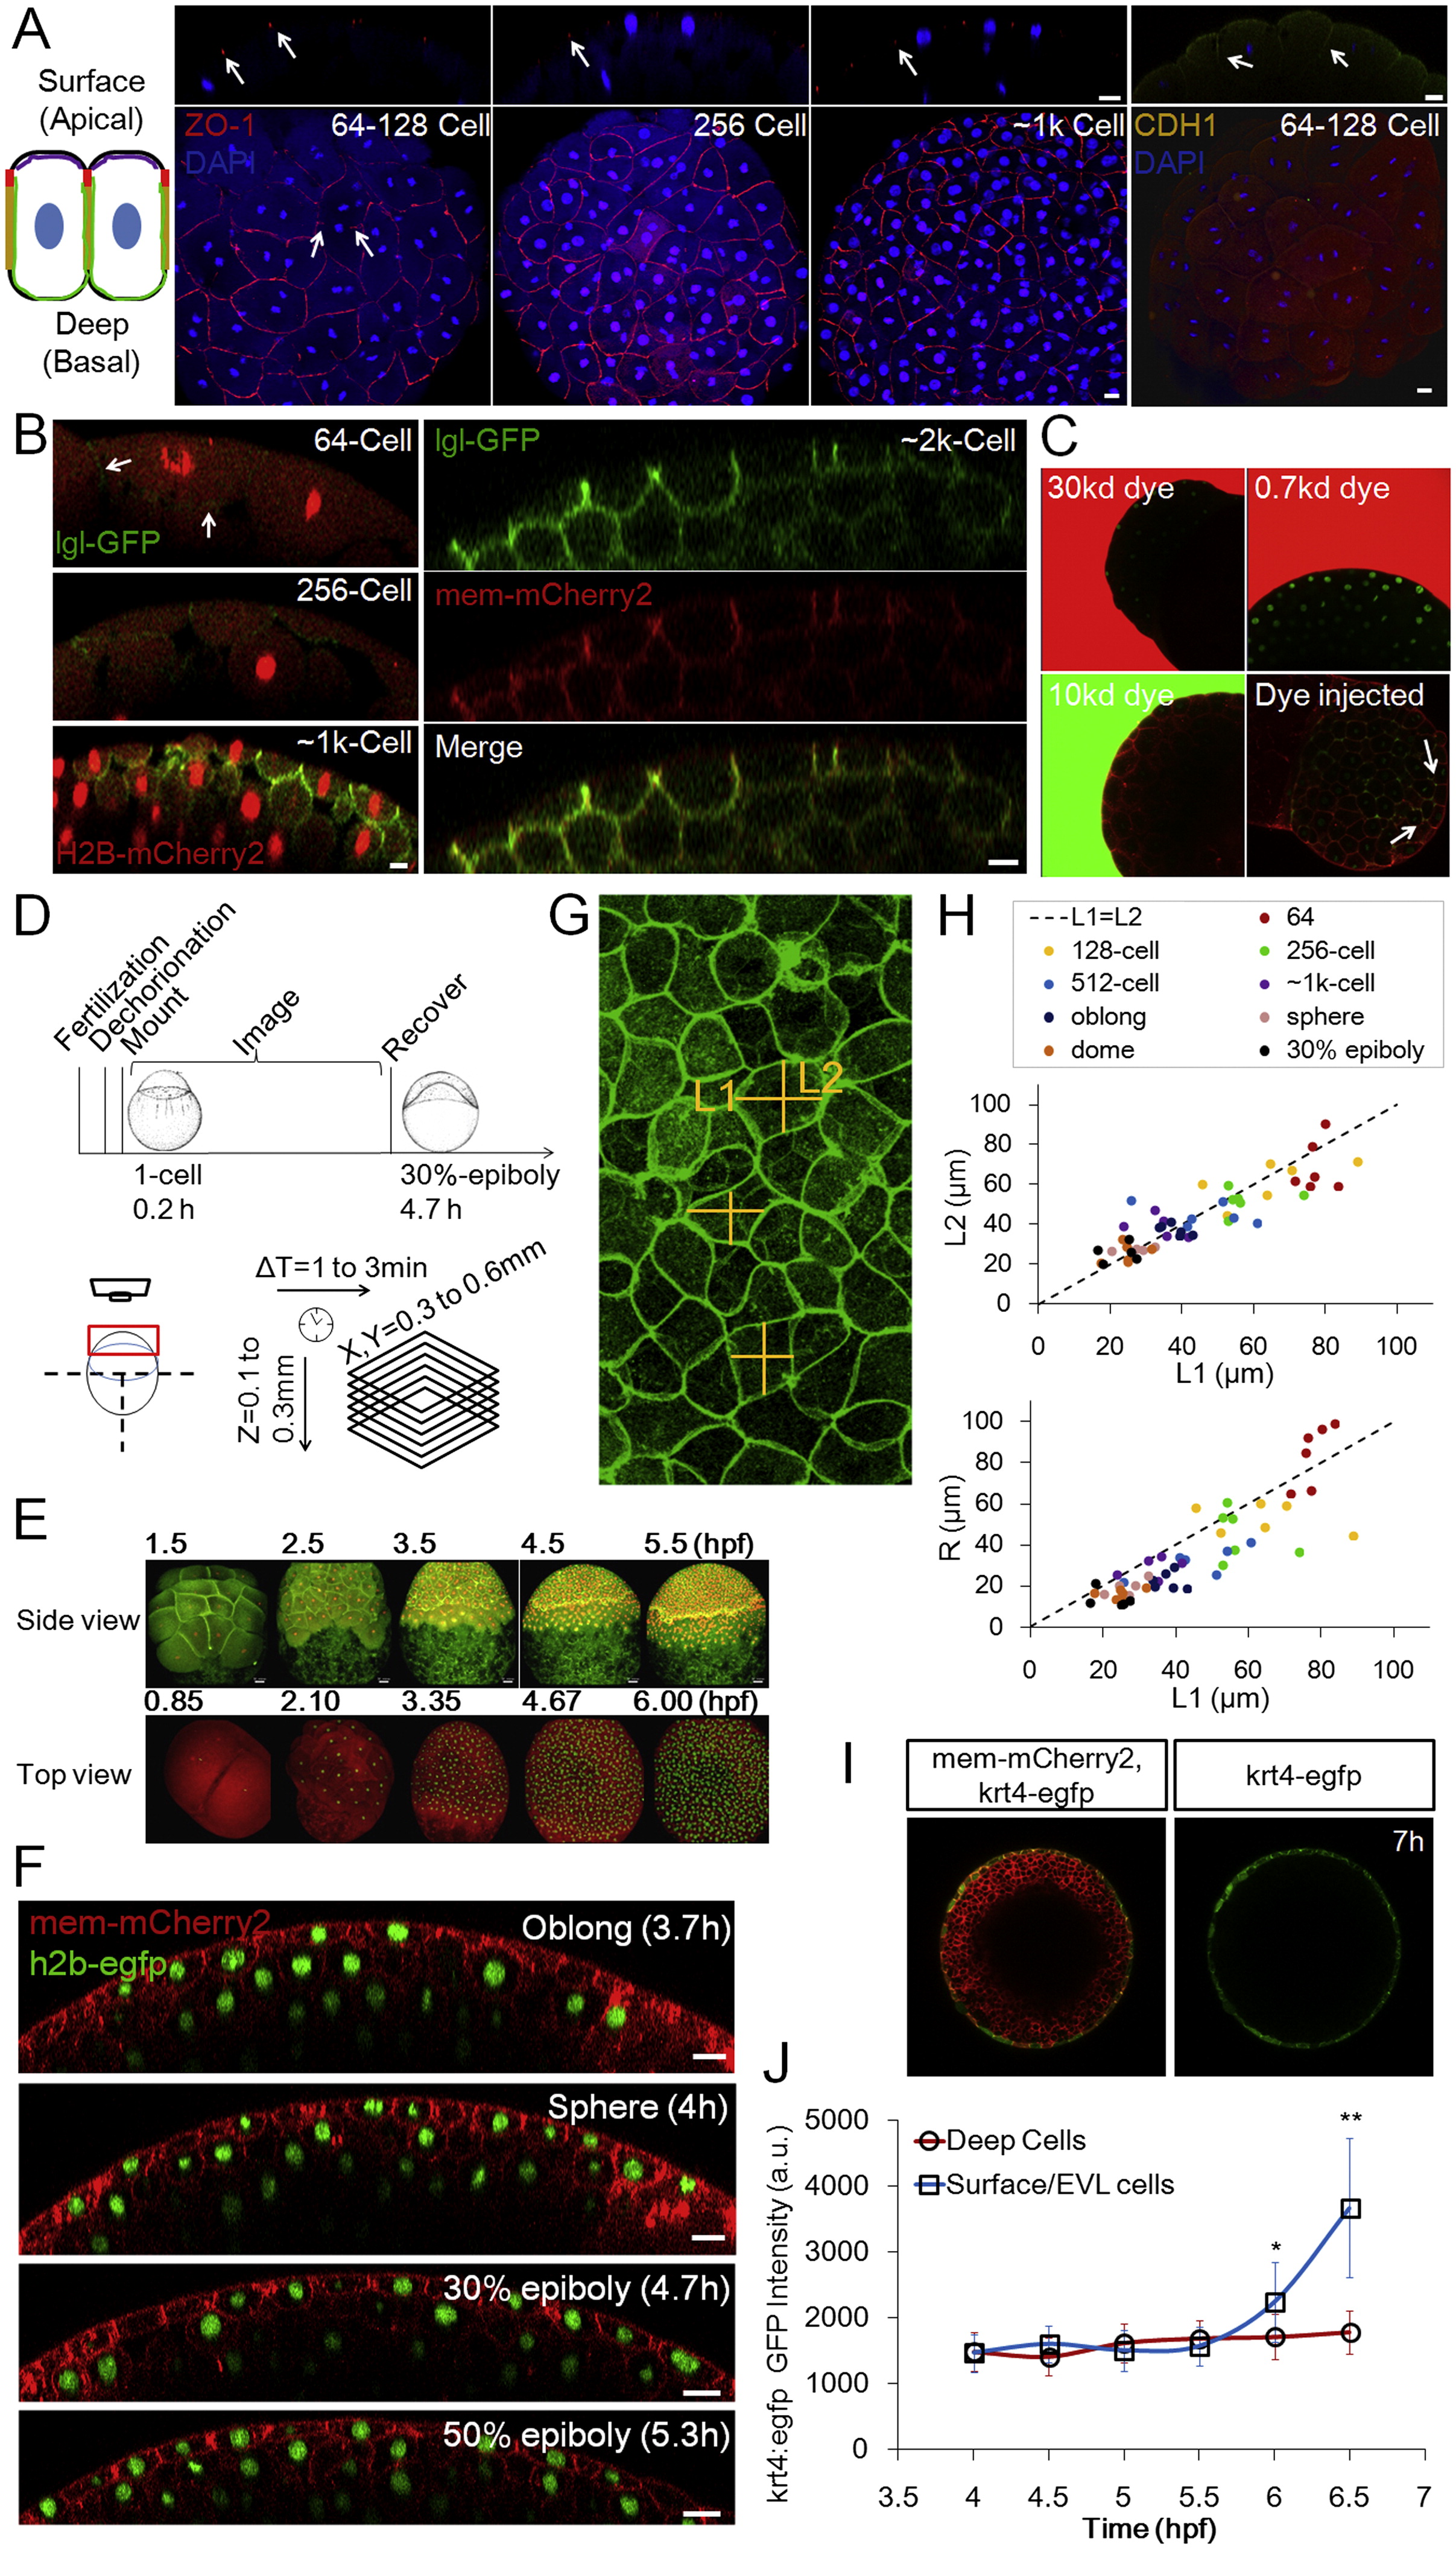
(A) Junction and polarity analysis of the surface cells. The schematic illustration shows two adjacent surface cells. Red indicates tight junctions as shown in ZO-1 staining images on the right; yellow indicates adherens junctions as shown by E-cadherin (CDH1) staining; green corresponds to the basal-lateral marker lgl as shown in (B); purple indicates aPKC (Fukazawa et al., 2010 and Krens et al., 2011). Arrows indicate focused staining signals. Scale bars: 20µm.
(B) Live imaging of embryos injected with lgl-GFP (Chalmers et al., 2005) mRNA. The GFP signal is detectable by 64-cell stage albeit being quite weak. GFP is detected on the basal lateral surface but not the apical surface. Scale bars: 10µm.
(C) Diffusion barrier function of the surface layer (pre-EVL). Embryos (128,256-Cell stages) were soaked in fluorescent dyes of different sizes and imaged for <20 min. No dye signal was detectable under the surface layer even when the exterior imaging signal is saturated. As a positive control the 10kd dye was injected into the embryo. Dye signal was found between cells (arrows) and stayed (at least 20 min). Embryos are transgenic for h2b-EGFP and mem-mCherry2.
(D) Schematic illustration of imaging timeline and protocol, including imaging set-up and spatial-temporal coverage and resolution. Embryo illustrations courtesy of Kimmel et al. (1995). See also Extended Experimental Procedures.
(E) Example time courses focusing on a lateral view and a top view, respectively. Fluorescent proteins labeling the membrane and the nucleus of cells were used. Lateral view: mem-EYFP and h2b-tomato; top view: mem-mCherry and h2b-EGFP. The lateral view images were generated using a data set partially published in Xu et al. (2012).
(F) Extended timelapse imaging data following Figure 1D. Scale bars: 20µm.
(G) Error analysis of L/R simplification in zebrafish surface cells. The image (3D maximum projection) illustrates free cell surfaces from a top view. The measurement of L in cross-sections (Figures 1D and S1F) brings an error as a difference between L1 and L2 exists.
(H) Comparison of L1/L2 and L1/R at different stages in surface cells. The L1/R difference is 13.5% ± 14.3% while L1/L2 difference is 0.5% ± 11.4%. n = 51. This indicates that using either L1 or L2 for calculating < L/R > is equivalent. The difference between L1 and L2 has a standard deviation of <11% which introduces a small amount of variability in L/R values that affects the accuracy of reported L/R distribution. See discussion in Data S1, Text 2.
(I) tg(krt4:egfp-caax) EGFP expression in differentiated EVL cells (Krens et al., 2011).
(J) Time course of tg(krt4:egfp-caax) EGFP intensity in surface cells and deep cells. n = <70 cells per time point measured. At 5.5h p = 0.08; p = 5e-6; p = 1e-14 (t tests).
Reprinted from Cell, 159, Xiong, F., Ma, W., Hiscock, T.W., Mosaliganti, K.R., Tentner, A.R., Brakke, K.A., Rannou, N., Gelas, A., Souhait, L., Swinburne, I.A., Obholzer, N.D., Megason, S.G., Interplay of Cell Shape and Division Orientation Promotes Robust Morphogenesis of Developing Epithelia, 415-427, Copyright (2014) with permission from Elsevier. Full text @ Cell