
|
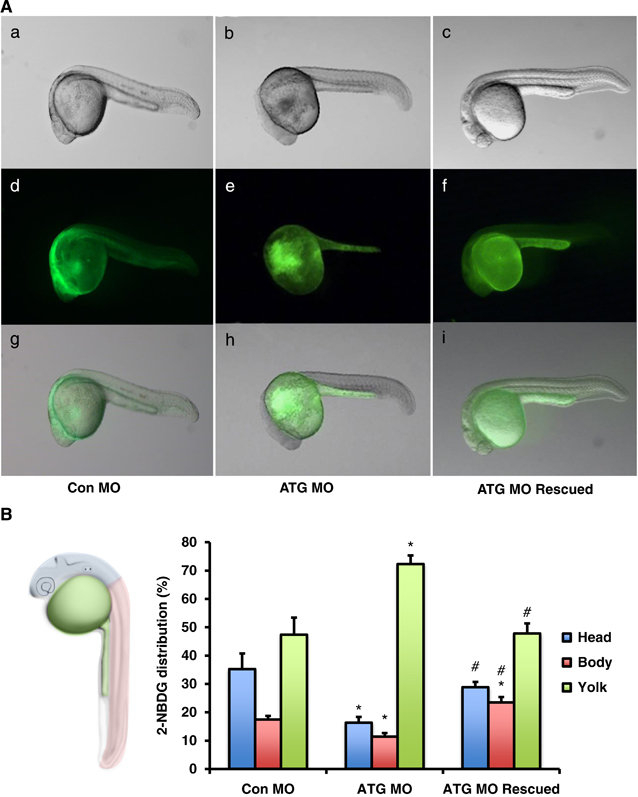
Fig. 4
Knockdown of glut2 results in inhibition of glucose uptake in vivo. (A) (a–i) Bright field (upper line, a–c), fluorescent (middle line, d–f), and overlay (bottom line, g–i) pictures of control, ATG morphants, and rescued embryos at 24 hpf. (B) Measurement of fluorescent signal in embryos injected with 2-NBDG. Control injected embryos (a, d, and g) displayed significant amounts of fluorescent glucose throughout the embryo; in contrast, ATG morphants (b, e, and h) showed very minimal fluorescent glucose visible at 60 minutes after injection. Embryos injected with ATG MO+rat GLUT2 mRNA (ATG MO Rescued) recovered glucose uptake to levels similar to Con MO (c, f, and i). * indicates significant differences compared with the Con MO injected embryos (*P<0.05; **P<0.01; ***P<0.001). # indicates significant differences compared with ATG MO injected embryos (##P<0.01; ###P<0.001).