
|
Fig. 3
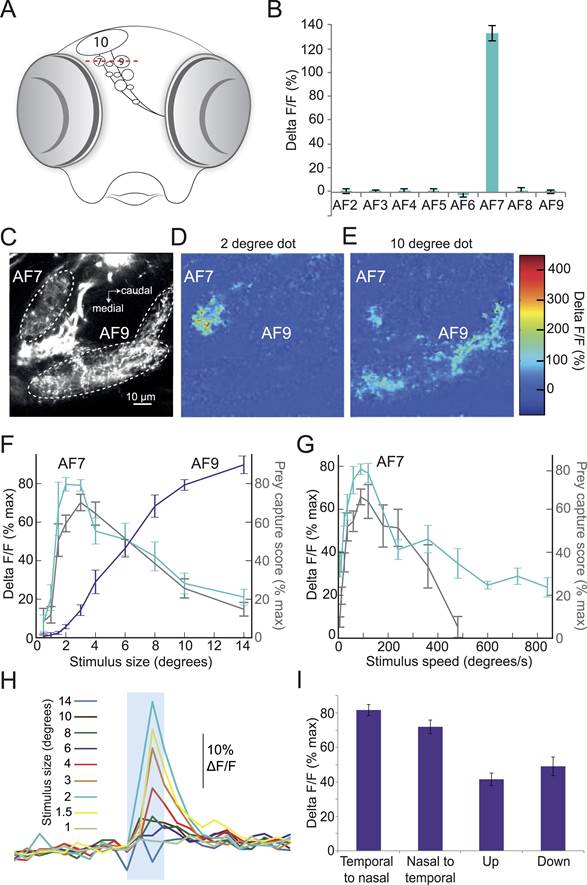
Prey stimuli activate RGC axons that project to AF7.
(A) Schematic frontal view of the brain showing AFs. Red line indicates imaging plane for C–G.
(B) Response to the ideal prey stimulus (3° dot, 90°/s) in other AFs in an Isl2b:Gal4, UAS:GCaMP6s transgenic larva. n = 9 larvae. (C) Baseline fluorescence of RGCs in an Isl2b:Gal4, UAS:GCaMP3 larva. (D) Peak frame in the response to a 2° dot. (E) Peak frame in the response to a 10° dot. (F) Response of all larvae (n = 9) to stimuli 0.5–14° in diameter. ROIs were defined anatomically as in (C). The ΔF/F is plotted as a percentage of the maximum response for that larva. Grey lines represent the behavioral tuning curve from Figure 2A. (G) Response of AF7 RGC axons to a 3° dot travelling at a speed of 6–800°/s. Grey lines represent the behavioral tuning curve from Figure 2B. (H) Responses of AF7 to a range of different size stimuli. Blue box represents the one second interval when the stimulus was onscreen. (I) AF7 response to 3° dot moving in various directions. n = 10 larvae. Error bars = ±SEM. See Figure 3—figure supplement 1 for tuning properties of tectal RGC axons.