
|
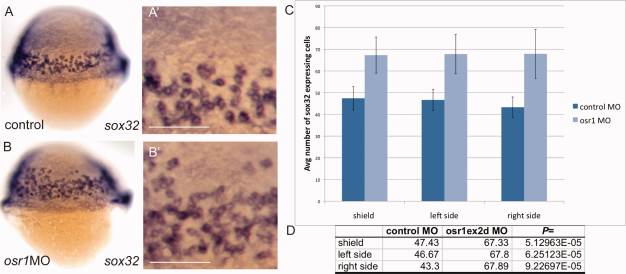
Fig. 6 Loss of osr1 increases the number of sox32-expressing endoderm cells. sox32-expressing cells were counted in osr1 morphants and embryos injected with a control morpholino. A, B: Lateral views of control and osr1 morphant embryos, respectively (dorsal is on the right). Cells were counted in identical-sized windows (area = 0.05 mm2) (A′, B′) on both lateral sides and the dorsal side (shield). C: Average number of cells per 0.05mm2 on each side. D: Welch′s t-test analysis indicates that osr1 morphant embryos show a significant increase in the number of sox32-expressing cells. n=7 (control); n=10 (osr1 MO). Scale bar in A′, B′ = 0.1 mm.