
|
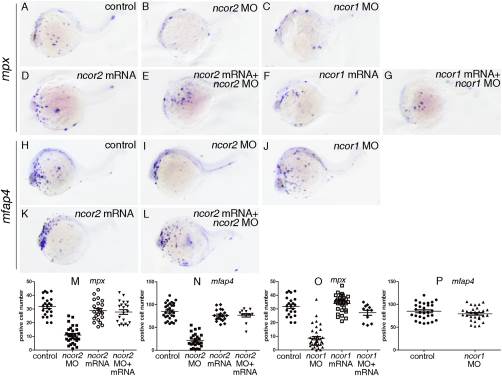
Fig. 1 Abnormal development of myeloid cells in zebrafish ncor2 or ncor1 morphants at 24 hpf. A–G: mpx expression was detected by whole-mount in situ hybridization when embryos were microinjected with control MO (A), ncor2 MO (B), ncor1 MO (C), ncor2 mRNA (D), ncor2 mRNA plus ncor2 MO (E), ncor1 mRNA (F), and ncor1 mRNA plus ncor1 MO (G), respectively. H–L: mfap4 expression was detected by whole-mount in situ hybridization when embryos were microinjected with control MO (H), ncor2 MO (I), ncor1 MO (J), ncor2 mRNA (K), and ncor2 mRNA plus ncor2 MO (L), respectively. M: The scatter plot showing the number of mpx+ cells in the embryos microinjected with control MO, ncor2 MO, ncor2 mRNA, and ncor2 mRNA plus ncor2 MO, respectively. N: The scatter plot showing the number of mfap4+ cells in the embryos microinjected with control MO, ncor2 MO, ncor2 mRNA, and ncor2 mRNA plus ncor2 MO, respectively. O: The scatter plot showing the number of mpx+ cells in the embryos microinjected with control MO, ncor1 MO, ncor1 mRNA, and ncor1 mRNA plus ncor1 MO, respectively. P: The scatter plot showing the number of mfap4+ cells in the embryos microinjected with control MO and ncor1 MO, respectively. All embryos are pictured at 24 hpf. They were positioned anterior left and viewed laterally.