
Image
|
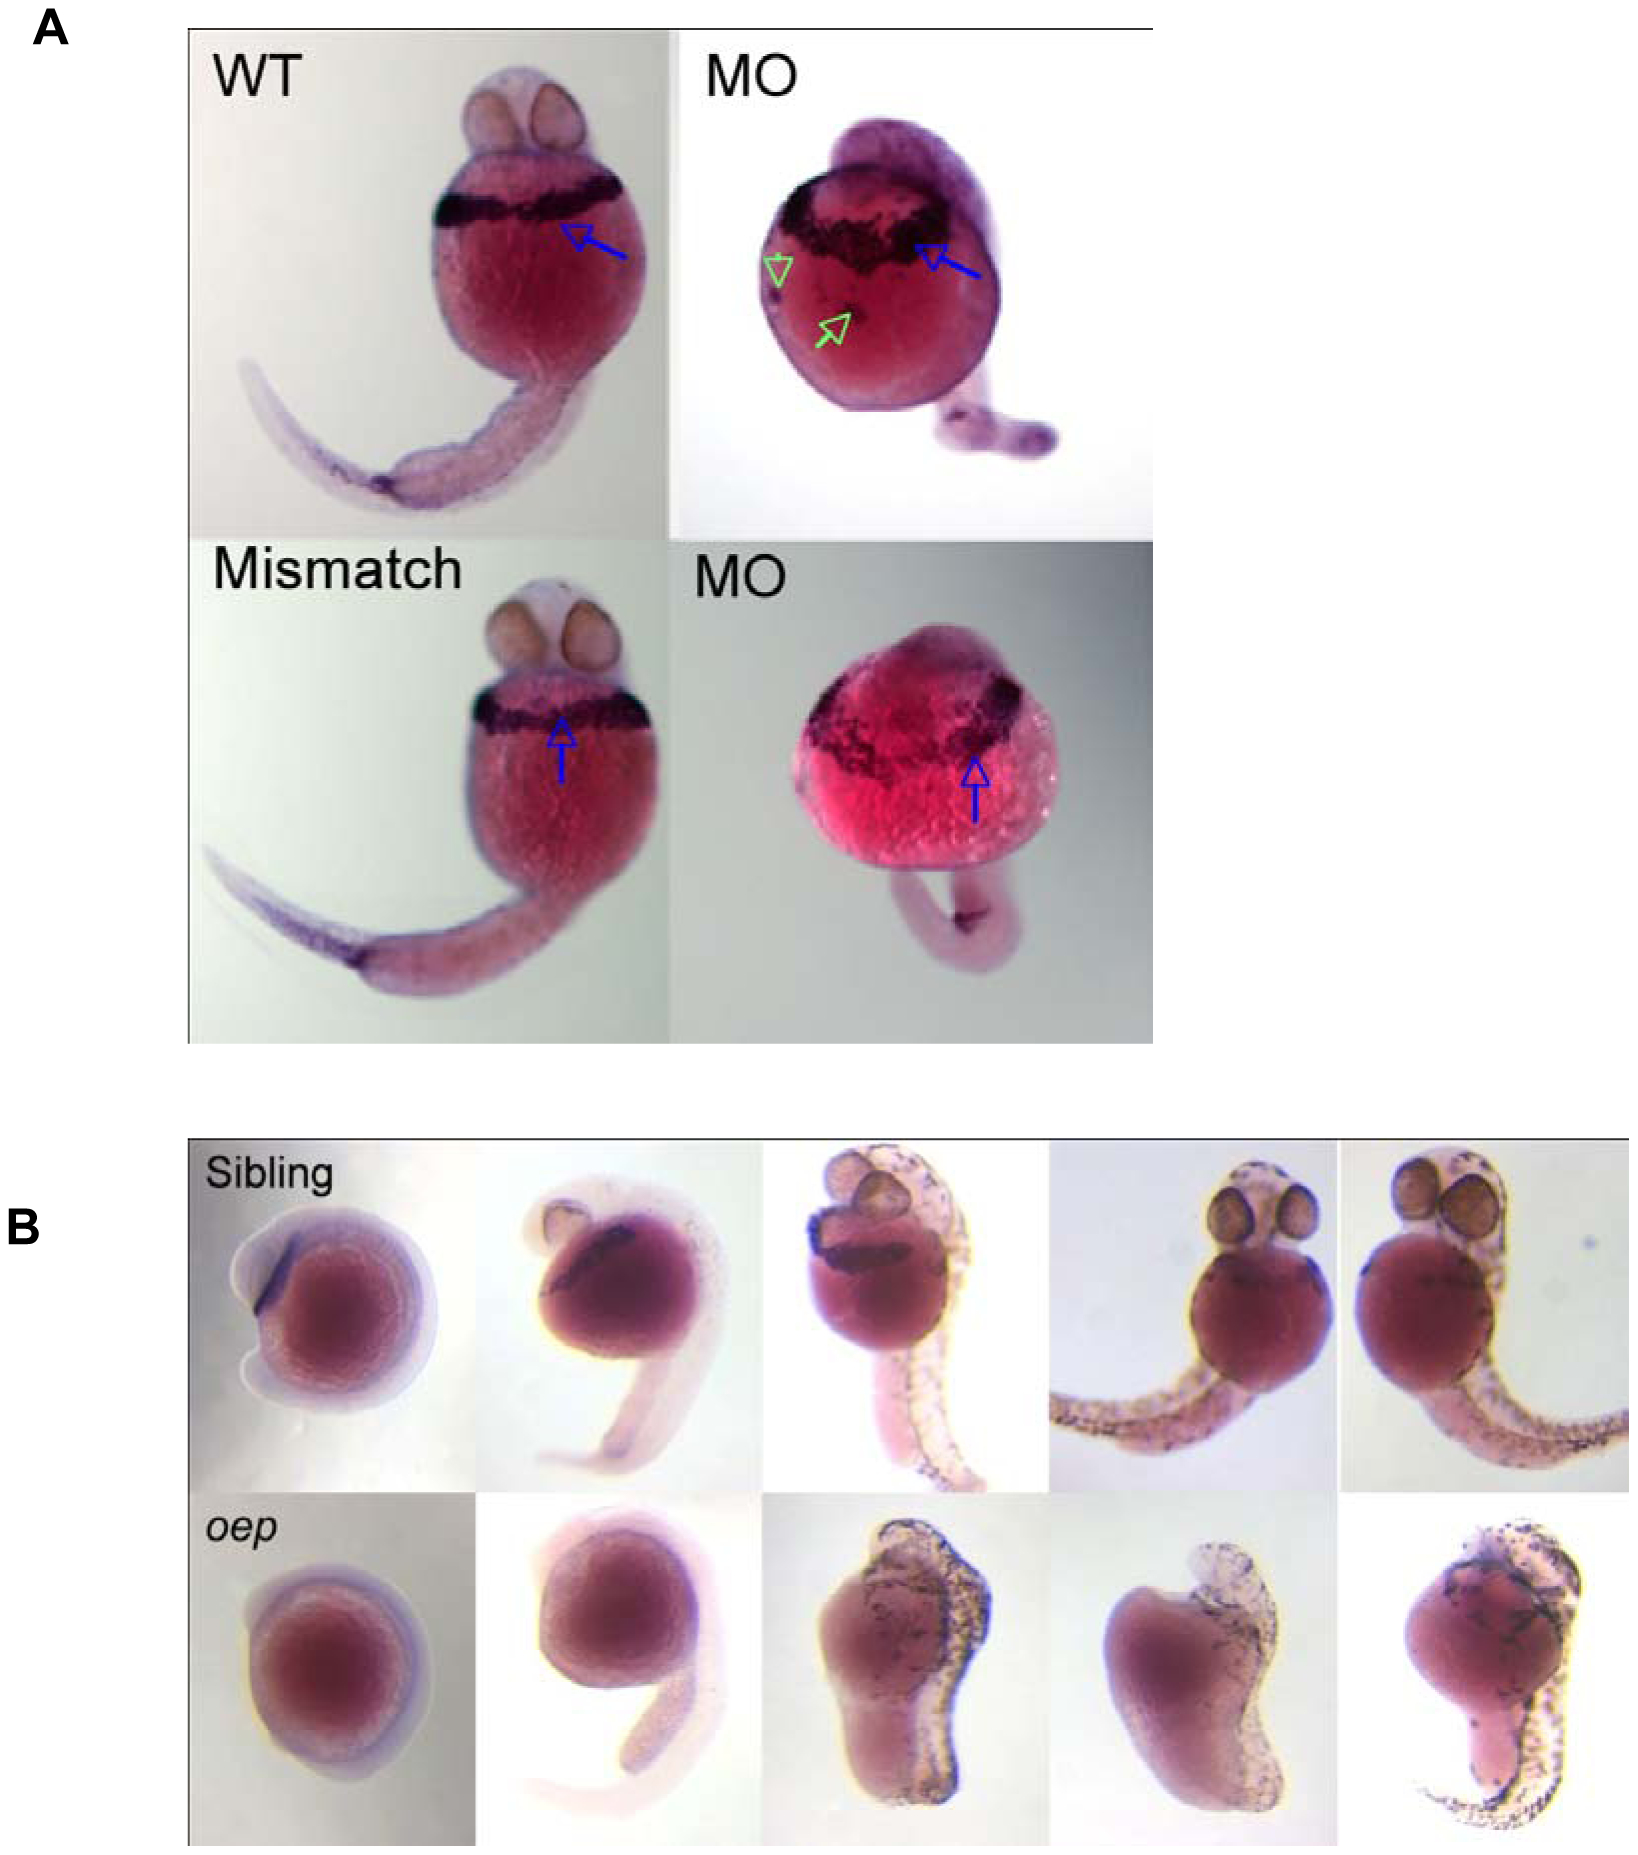
Figure Caption
Fig. 5
Location of cd63 transcript as revealed by ISH.
A. 32 h.p.f LWT dechorinated embryos injected with 10 pg MO4 as indicated. Blue arrows indicates hatching gland; green arrows denote mis-localised hatching gland cell clumps B. One Eyed Pinhead (oep) mutants and siblings. The top row are sibling embryos homozygous or heterozygous for WT oep, where as the bottom row are homozygous for the oep deletion.
Figure Data
Acknowledgments
This image is the copyrighted work of the attributed author or publisher, and
ZFIN has permission only to display this image to its users.
Additional permissions should be obtained from the applicable author or publisher of the image.
Full text @ PLoS One