
Fig. 4
- ID
- ZDB-IMAGE-150115-23
- Genes
- Publication
- Fukuhara et al., 2014 - Visualizing the cell-cycle progression of endothelial cells in zebrafish
- All Figures
- Figures for Fukuhara et al., 2014
|
Fig. 4
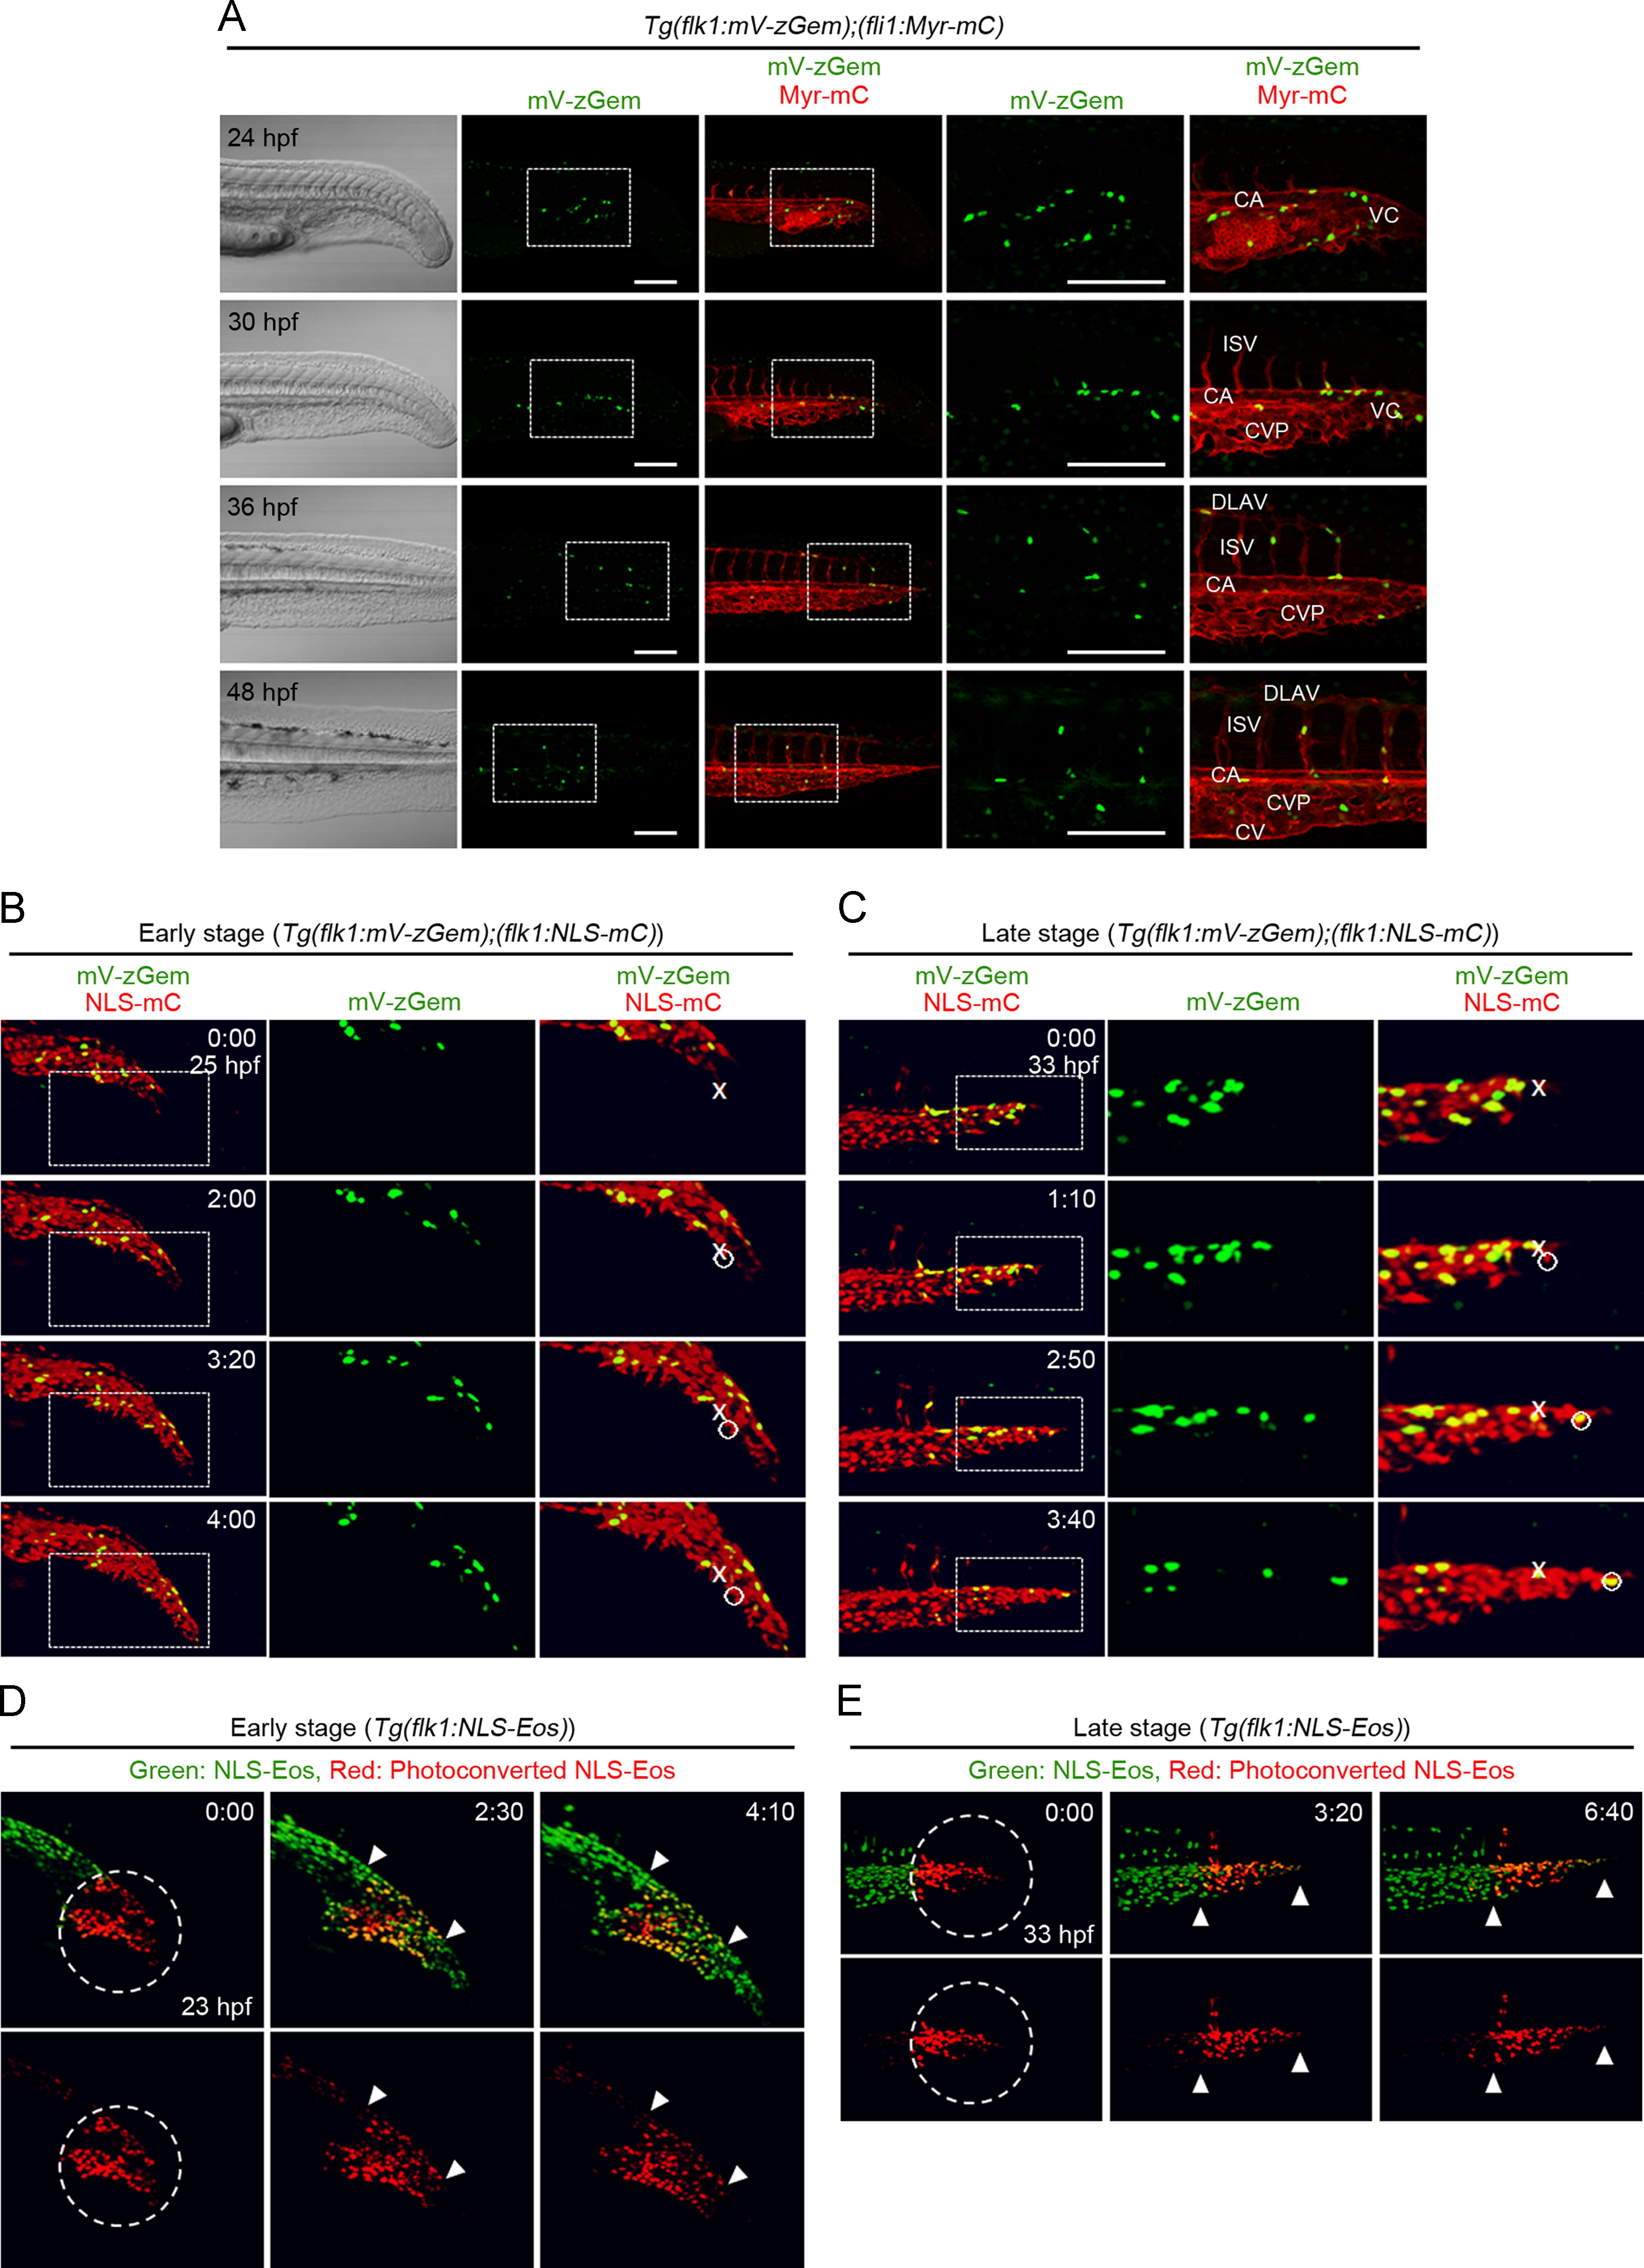
Cell-cycle progression of ECs during caudal vessel formation. (A) 3D-rendered confocal images of the caudal vessels of Tg(flk1:mV-zGem);(fli1:Myr-mC) embryos at 24, 30, 36 and 48 hpf as indicated in the first column from the left. Bright field images (left) and fluorescence images (as indicated at the top). The boxed areas of the second and the third columns are enlarged in the fourth and fifth columns, respectively. CA, caudal vessel; VC, vascular cord; ISV, intersegmental vessel; CVP, caudal vein plexus; DLAV, dorsal longitudinal anastomotic vessels. Scale bars, 100 μm. (B) Time-lapse confocal imaging of caudal vessel formation in the early stage (from 25 to 29 hpf) in the Tg(flk1:mV-zGem);(flk1:NLS-mC) embryos. The confocal 3D image of the embryo at 25 hpf (top) and subsequent time-lapse images (from second to fourth rows) as indicated by the elapsed time (hr:min) at the top right. Left, merged (mVenus and mCherry); center, enlarged mVenus images of the boxed region of the left panel; right, enlarged merged image of the boxed region of the left panel. The cell movement of the posterior-most cell at the beginning (crosses) and at the end (circles) during time-lapse imaging, as analyzed employing a cell tracking application. (C) Tg(flk1:mV-zGem);(flk1:NLS-mC) embryos in the late stage (from 33–37 hpf) were similarly time-lapse imaged and analyzed as in B. Note that NLS-mCherry-positive cells merge just posterior to the growing edges of caudal vessels in the early stage, but not in the late stage, of caudal vessel formation. (D) Time-lapse confocal imaging of caudal vessel formation at the early stage (from 23 to 27 hpf) in the Tg(flk1:NLS-Eos) embryos. Confocal 3D images (at 23 hpf) and subsequent time-lapse images of photoconverted NLS-Eos (red)-marked ECs (encircled) from original NLS-Eos (green)-marked cells by laser irradiation at 23 hpf. Elapsed time (hr:min). Upper, merged images of Eos (green) and photoconverted Eos (red); lower, photoconverted Eos (red) images. Arrowheads indicate the anteriormost and posteriormost of the photoconverted cells. (E) Tg(flk1:NLS-Eos) embryos in the late stage (from 33 to 40 hpf) were time-lapse imaged and analyzed as in D.
Reprinted from Developmental Biology, 393(1), Fukuhara, S., Zhang, J., Yuge, S., Ando, K., Wakayama, Y., Sakaue-Sawano, A., Miyawaki, A., Mochizuki, N., Visualizing the cell-cycle progression of endothelial cells in zebrafish, 10-23, Copyright (2014) with permission from Elsevier. Full text @ Dev. Biol.