
IMAGE
Fig. S1
- ID
- ZDB-IMAGE-150115-19
- Genes
- Publication
- Fukuhara et al., 2014 - Visualizing the cell-cycle progression of endothelial cells in zebrafish
- All Figures
- Figures for Fukuhara et al., 2014
Image
|
Figure Caption
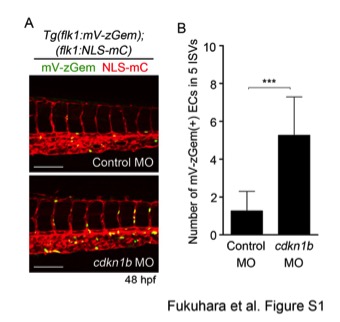
Fig. S1 Time-lapse confocal imaging of an EC-zFucci embryo. (A) 3D-rendered confocal images of the trunk regions of Tg(flk1:mV-zGem);(flk1:NLS-mC) embryos injected with control MO (upper panel) or cdkn1b MO (lower panel) at 48 hpf. Upper, merged images (mVenus [green] and mCherry [red]) of control morphants; lower, those of cdkn1b morphants. (B) The number of mV-zGem-positive cells within the five ISVs. Data are shown as mean ± s.d. (n=15). ***p<0.001.
Figure Data
Acknowledgments
This image is the copyrighted work of the attributed author or publisher, and
ZFIN has permission only to display this image to its users.
Additional permissions should be obtained from the applicable author or publisher of the image.
Reprinted from Developmental Biology, 393(1), Fukuhara, S., Zhang, J., Yuge, S., Ando, K., Wakayama, Y., Sakaue-Sawano, A., Miyawaki, A., Mochizuki, N., Visualizing the cell-cycle progression of endothelial cells in zebrafish, 10-23, Copyright (2014) with permission from Elsevier. Full text @ Dev. Biol.