
|
Fig. S2
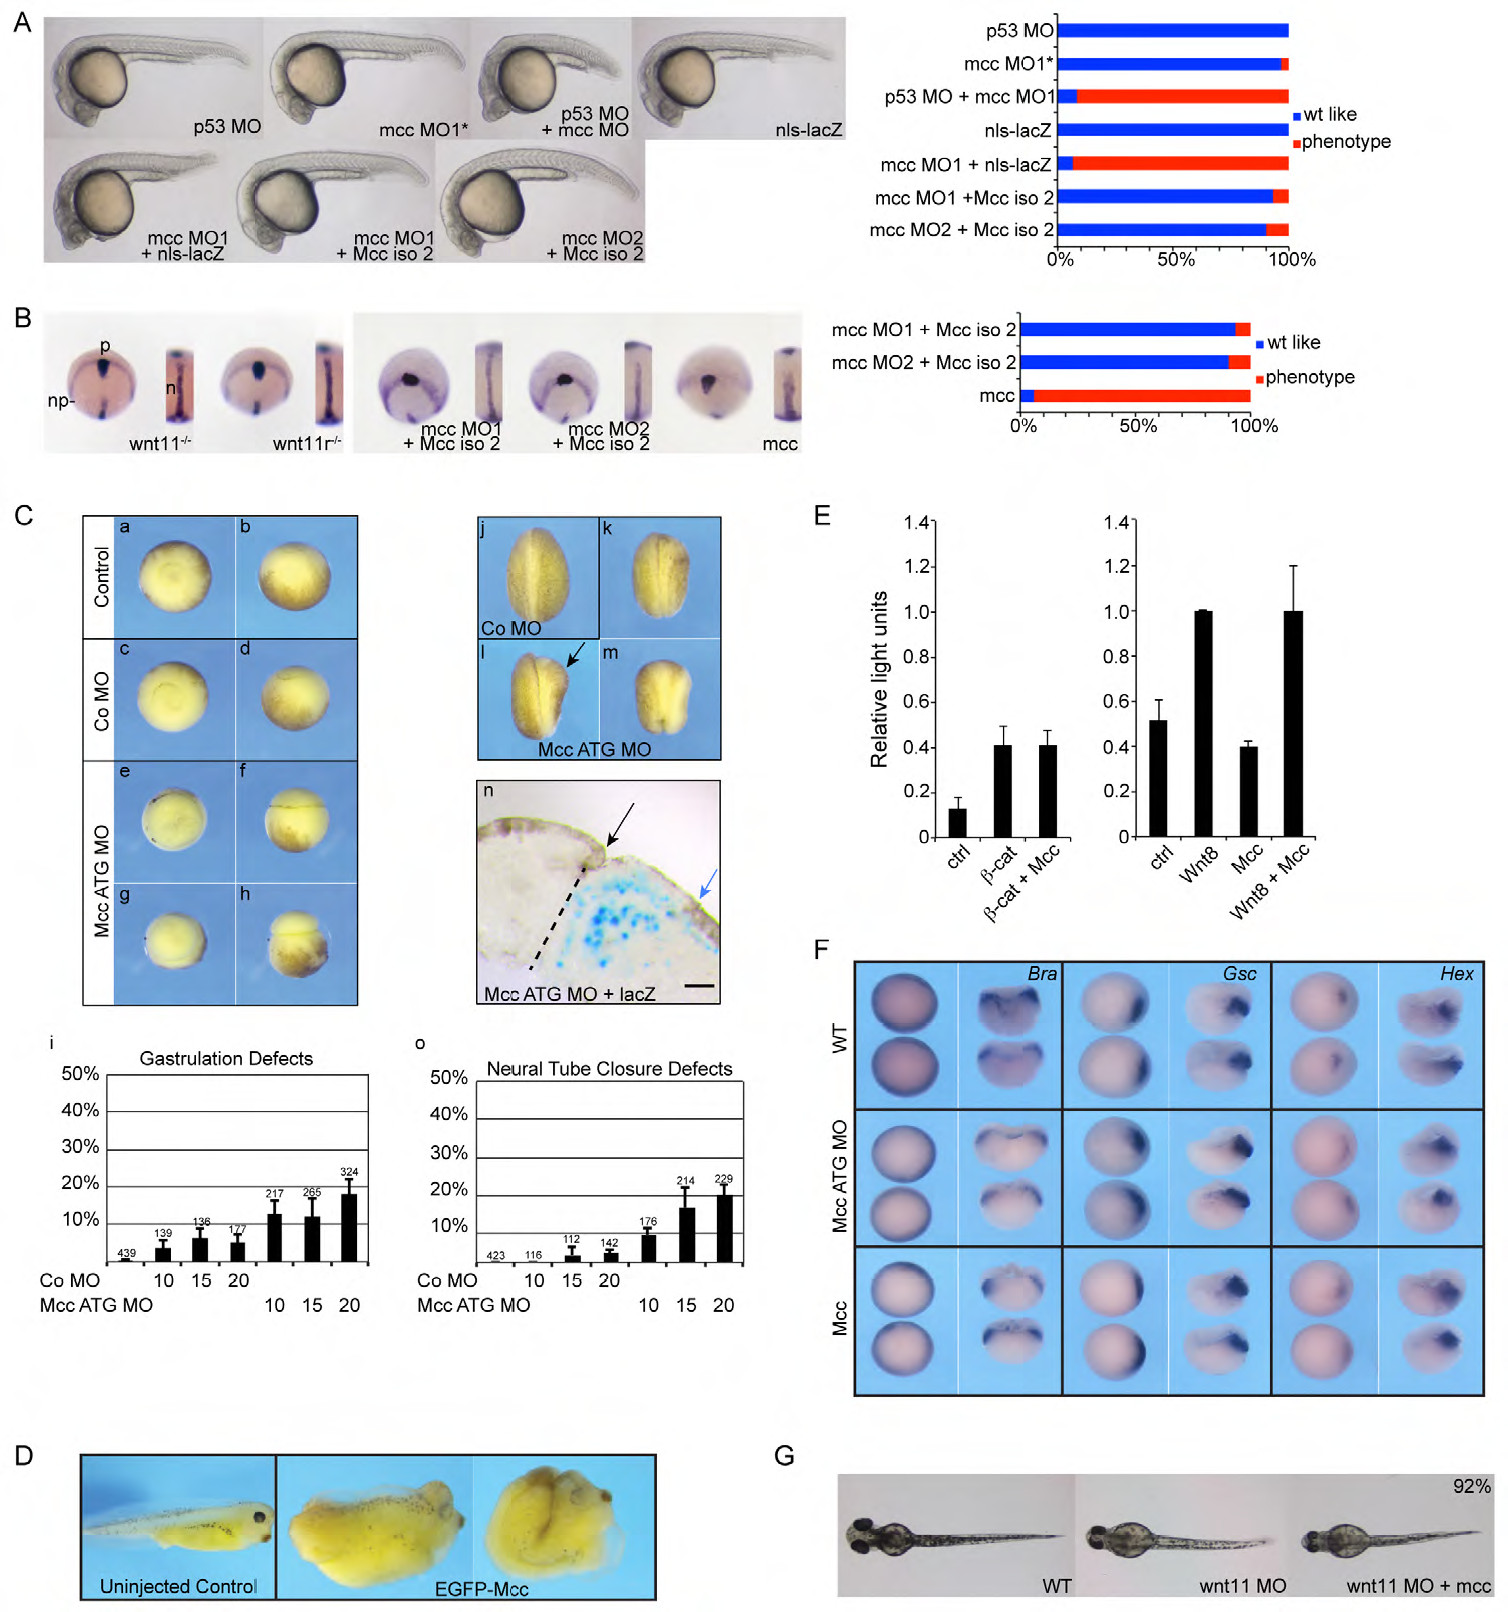
Supporting information for Figure 2. (A) Series of control mRNA and morpholino injections at 1 day post fertilization (dpf): p53 MO alone; mcc mismatch control morpholino (MO1*); co-injection of p53 MO and mcc MO1, which attenuates the anterior cell death sometimes observed with either mcc MO1 or MO2 (Fig. 2A); overexpression of nls-lacZ mRNA; and co-injection of mcc MO1 and nls-lacZ mRNA. Injection of the shorter mouse Mcc isoform 2 mRNA, like isoform 1 (Fig. 2A), efficiently rescues both mcc MO1 and MO2. (B) wnt11/slb and wnt11-related (wntllr) homozygous mutant embryos (Heisenberg et al., 2000; Matsui et al., 2005) at 10 hpf show characteristic convergence and extension defects: the polster (hgg1) lags behind the wider neural plate (dlx3) and the midline notochord (ntl1) is thickened. These phenotypes are seen in mcc MO1 or MO2-injected embryos and are rescued equally as efficiently by mouse Mcc isoform 2 mRNA as isoform 1 (Fig. 2A). Overexpression of zebrafish mcc results in similar CE defects as mcc MO1 or MO2 injection (Fig. 2A). Abbreviations: np, neural plate; p, polster; n, notochord. (C) Mcc loss of function in Xenopus leads to an increase of embryos with gastrulation and neural tube closure defects. Embryos were injected at the 2-cell stage with 10, 15, or 20 ng control or Mcc ATG MO. Gastrulation defects were analyzed at stage 11 (a-i) and neurulation defects (j-o) at stage 19. Vegetal (a,c,e,g) or lateral (b,d,f,h) views of gastrula stage embryos are shown. Neurula stage embryos are shown from a posterior view, the injected site is on the right (j-m). (a,b) Uninjected control embryo. (c,d) Embryo injected with 20 ng control MO (Co MO) showing normal gastrulation. (e-h) Embryos injected with 20 ng Mcc ATG MO showing defective blastopore closure (e,f) and exogastrulation (g,h). (i) Graph summarizing the percentage of gastrulation defects in three independent experiments. MO concentrations (10, 15 or 20) are in ng. Standard error of the mean and number of injected embryos are indicated for each column. The same embryos were analyzed for neural tube closure defects at stage 19 (j-m,o). (j) Embryo injected with 20 ng control MO shows normal neural tube closure. (k,l,m) Embryos injected with 20 ng Mcc ATG MO show defective neural tube closure on the injected site (right). (n) Transverse section through the neural tube of an embryo injected with 20 ng Mcc ATG MO together with lacZ RNA (blue staining, indicates the injected side; dashed line indicates the midline). Black arrow marks the hinge point and the rolled up neural tube of the control site. The blue arrow marks the hinge point area of the injected side. Note the distance between the blue arrow and the midline suggesting defects in cell intercalation on the injected site. Scale bar = 50 μm. (o) Graph summarizing the percentage of neural tube closure defects of the same embryos as shown in (i). (D) Mcc overexpression (2ng of EGFP-Mcc mRNA) in Xenopus results in foreshortening and buckling of the anteroposterior axis—two classic CE phenotypes (St 38). (E) Activation of the canonical, β-catenin-dependent Siamois luciferase reporter (Brannon et al., 1997) is not affected by Mcc overexpression in injected Xenopus embryos. See Materials and Methods for additional details about luciferase reporter constructs and DNA/mRNA concentrations. (F) Early gastrulation and germ layer specification are unperturbed in Xenopus Mcc morphants. Whole-mount in situ hybridization for Brachyury (Bra, pan-mesodermal), Gsc (dorsal organizer) and Hex (nascent endoderm) expression at St 10.5. Alternating animal pole and hemisected views are shown for each riboprobe with dorsal to the right. (G) Zebrafish embryos at 52 hpf. Wild-type (WT) uninjected, wnt11 MO injected, and co-injection of wnt11 MO with zebrafish mcc mRNA. wnt11 morphants typically have eyes that are too close together or fused (Heisenberg et al., 2000)—a phenotype that is not rescued upon mcc overexpression. (A-E) Morpholino and mRNA concentrations are provided in Supp. Table 3. Phenotypic distributions are indicated as percentages, with scored embryo counts listed in Supp. Table 4.