
Image
|
Figure Caption
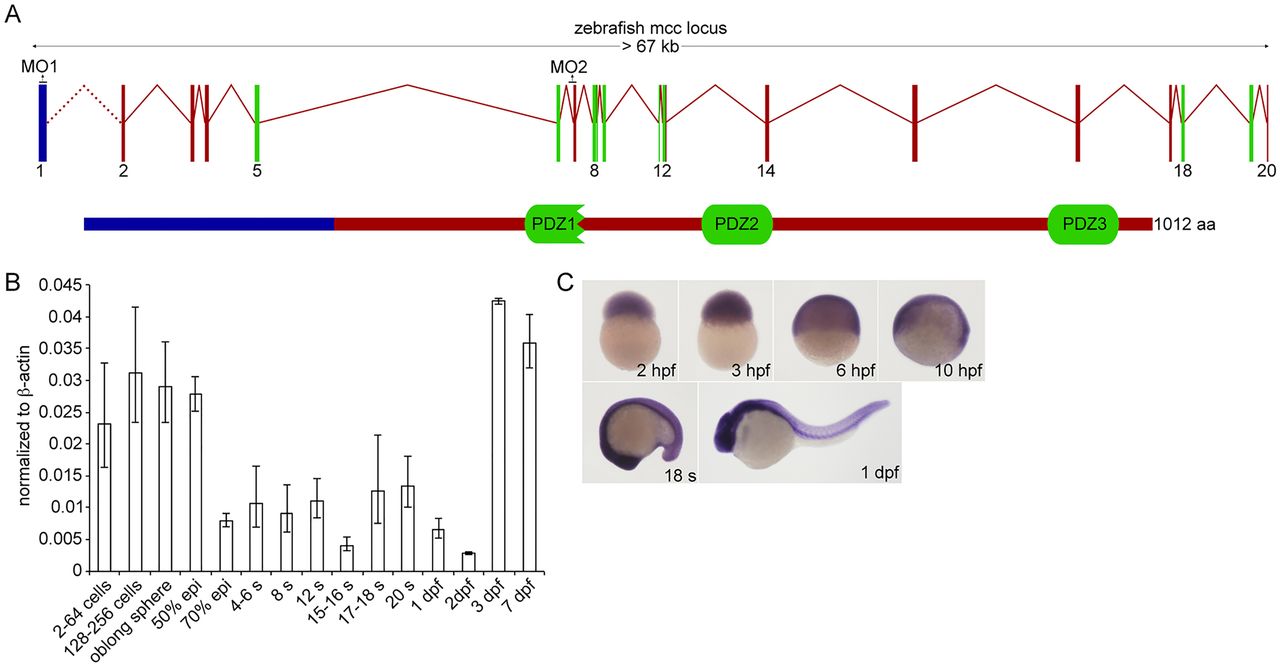
Fig. 1
Zebrafish Mcc structure and embryonic expression. (A) Schematic of the zebrafish mcc genomic locus. The exact distance between exons 1 and 2 is unknown (dotted line). The 1012 amino acid (aa) Mcc protein (lower schematic) contains three PDZ domains. (B) Q-PCR analysis of mcc expression in the zebrafish embryo at maternal (2-256 cells) and zygotic (oblong sphere and beyond) stages. Data are normalized to β-actin. Error bars indicate s.e.m. epi, epiboly; s, somite. (C) mcc expression from 2hpf to 1dpf assessed by WISH.
Figure Data
Acknowledgments
This image is the copyrighted work of the attributed author or publisher, and
ZFIN has permission only to display this image to its users.
Additional permissions should be obtained from the applicable author or publisher of the image.
Full text @ Development