
|
Fig. S2
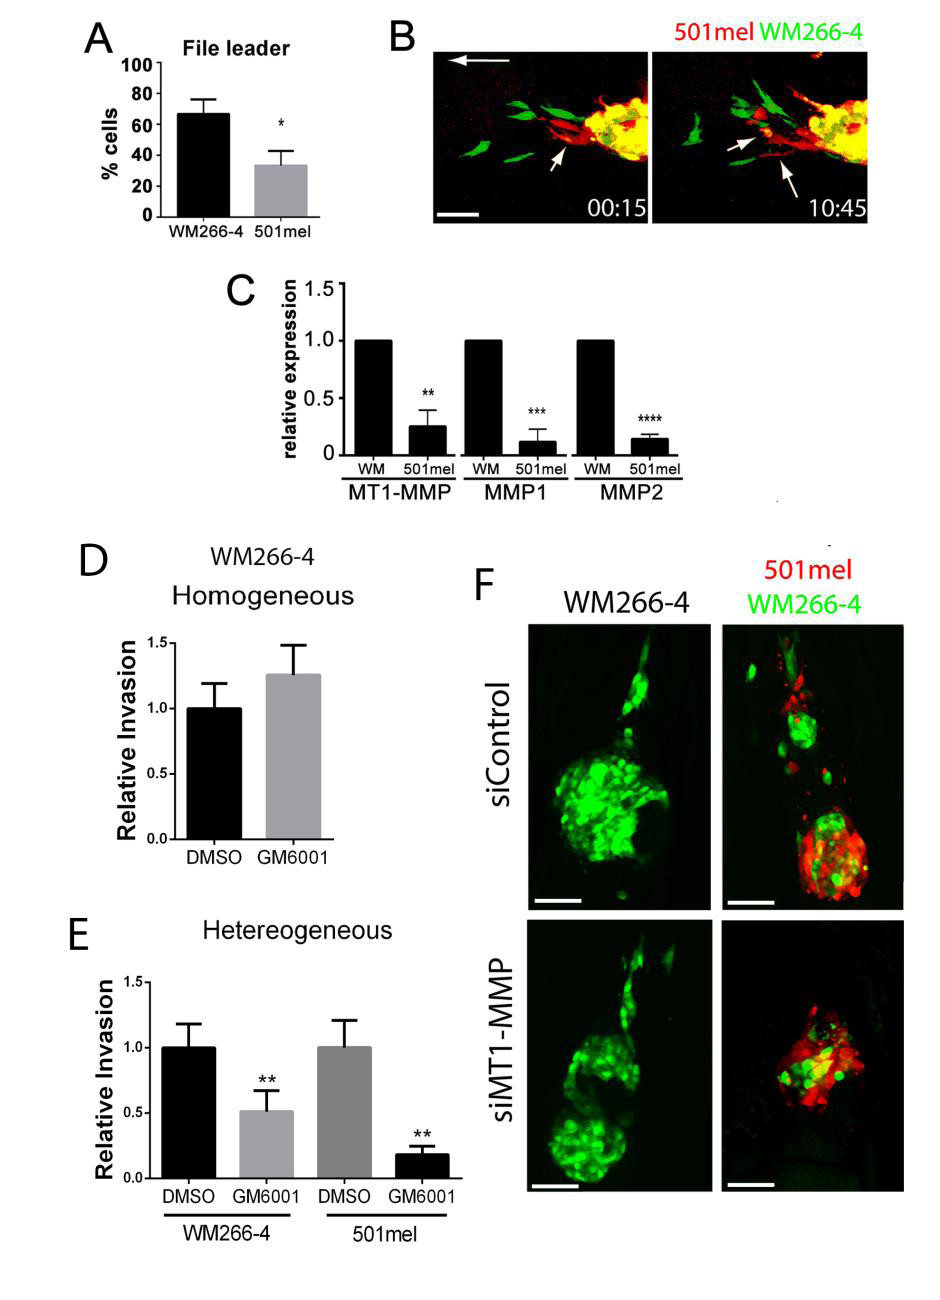
Follower-leader behaviour underlies co-operative invasion in heterogeneous xenografts— a crucial role for MT1-MMP. (Related to Figure 2.)
(A) Quantification of file leader; mean ± SEM; Mann-Whitney test; * = p<0.05; N e 26 from 3 independent experiments. (B) Video time-lapse stills showing WM266-4 ‘leader’ cells and 501mel ‘follower’ cells (white arrows); scale bar = 50 μm. (C) Relative MMP expression determined by RT-qPCR from 3 independent experiments. Mean ± SEM; unpaired Student’s T-test; ** = p <0.01; *** = p < 0.001; **** = p < 0.0001. (D) Quantification of invasion of WM266-4 cells in homogeneous treated with either the vehicle control DMSO or GM6001; mean ± SEM; Mann-Whitney test; N ≥ 14 from 3 independent experiments. (E) Quantification of invasion of WM266-4 and 501mel cells in heterogeneous xenografts treated with either the vehicle control DMSO or GM6001; mean ± SEM; Kruskal-Wallis test followed by Dunn’s multiple comparisons test; ** = p<0.01; N e 17 from 3 independent experiments. (F) Representative images of WM266-4 cells transfected with either control or MT1-MMP specific siRNA in homogeneous and heterogeneous xenografts.