
|
Fig. S1
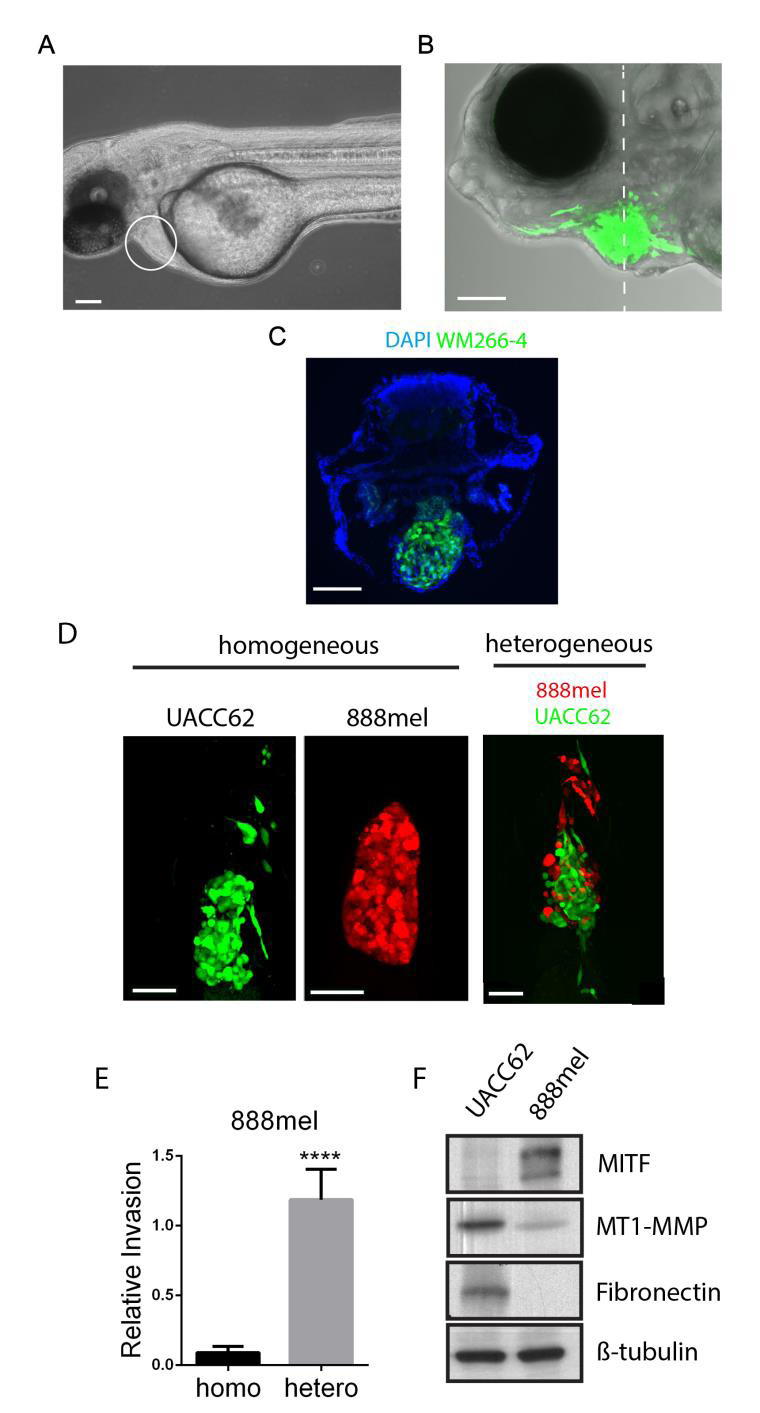
Zebrafish embryo melanoma xenografts. (Related to Figure 1.)
(A) A 48 hour post fertilisation zebrafish showing the pericardial cavity (white circle) as the site of xenograft injection. (B) GFP labelled WM266-4 melanoma cells injected into the pericardial cavity form a tumour-like mass capable of local invasion. Dashed line indicates plane of section in (C). (C) A cryo-section through the tumour like mass shown in (B) was labelled with DAPI (nuclei) and melanoma cells visualised through GFP fluorescence (weak autofluorescence is apparent at certain sites). The mass engrafted onto the body wall of the pericardial cavity. (D) UACC62 and 888mel homogeneous and heterogeneous xenografts. (E) Quantification of 888mel invasion depicted in (D) normalised to UACC62 invasion; mean ± SEM; Mann-Whitney test; **** = p < 0.0001; N e 26 from 3 independent experiments. (F) Western blot showing protein levels of MITF, MT1-MMP and fibronectin in UACC62 and 888mel cells. Scale bars = 100 μm.