
|
Fig. 4
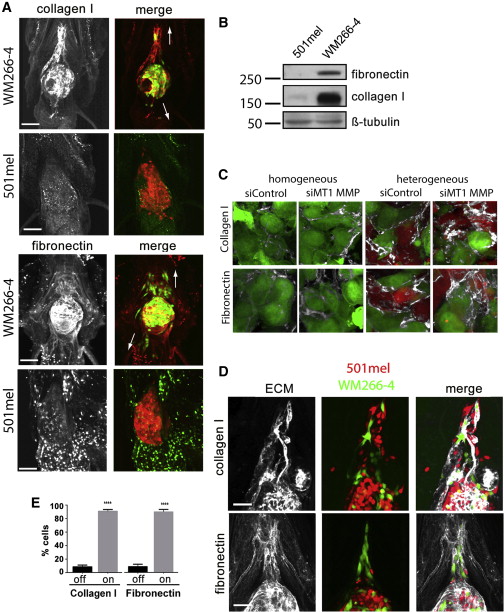
ECM Proteins Correlate with Invasiveness
(A) Expression of ECM components collagen I and fibronectin in engrafted zebrafish 4 dpi; arrows indicate direction of invasion.
(B) Western blot showing collagen I and fibronectin expression in WM266-4 and 501mel cells.
(C) Collagen I (upper) and fibronectin (lower) in homogeneous compared to heterogeneous xenografts that are further treated with either DMSO or GM6001.
(D) Invasive WM266-4 and 501mel follow collagen I (upper) and fibronectin (lower) tracks radiating out from the tumor.
(E) Quantitation of ECM association. Cells were scored as being in touch “on” with collagen I or fibronectin strands or not “off.” Mean ± SEM; unpaired Student’s t test (collagen) and Mann-Whitney test (fibronectin); p < 0.0001; n e 18 from three independent experiments.