
|
Fig. 2
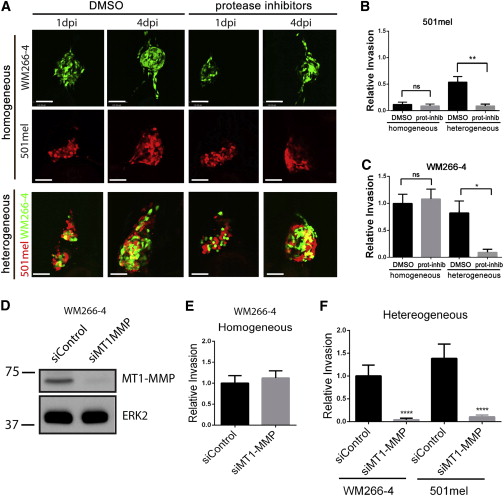
MMP Inhibition Suppresses Cooperative Invasion
(A) Homogeneous (upper) or heterogeneous (bottom) xenografts were treated with either the vehicle control DMSO (left) or protease inhibitor cocktail (right). Scale bars represent 100 μm.
(B) Quantitation of 501mel invasion depicted in (A); mean ± SEM; Kruskal-Wallis test followed by Dunn’s multiple comparisons test; p < 0.01; n e 9 from three independent experiments.
(C) Quantitation of WM266-4 invasion depicted in (A); mean ± SEM; Kruskal-Wallis test followed by Dunn’s multiple comparisons test; p < 0.05; n e 13 from three independent experiments.
(D) Western blot showing MT1-MMP expression in WM266-4 transfected with either control or MT1-MMP specific siRNA.
(E) Quantitation of invasion of WM266-4 cells in homogeneous xenografts wherein WM266-4 cells have been transfected with either control or MT1-MMP-specific siRNA; mean ± SEM; Mann-Whitney test; n e 21 from three independent experiments.
(F) Quantitation of invasion of WM266-4 and 501mel in heterogeneous xenografts wherein WM266-4 cells have been transfected with either control or MT1-MMP specific siRNA; mean ± SEM; Kruskal-Wallis test followed by Dunn’s multiple comparisons test; p < 0.0001; n e 24 from three independent experiments.