
|
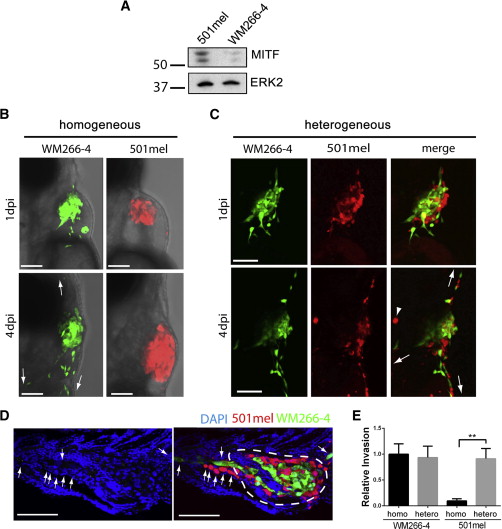
Fig. 1
Heterogeneity Results in Cooperative Invasion
(A) Western blot showing MITF expression in WM266-4 and 501mel cells.
(B) Homogeneous xenografts imaged at 1 (upper) and 4 days (lower) postinjection (dpi).
(C) Heterogeneous xenografts imaged at 1 (upper) and 4 dpi (lower).
Arrows indicate directions of invasion; arrowhead indicates autofluorescence.
(D) Section from engrafted embryo indicating primary tumor site (white dashed line) and infiltrating melanoma cells (white arrows). Scale bars represent 100 μm.
(E) Quantitation of invasion depicted in (A) and (B); mean ± SEM; Kruskal-Wallis test followed by Dunn’s multiple comparisons test; p < 0.01; n e 26 from three independent experiments.