
|
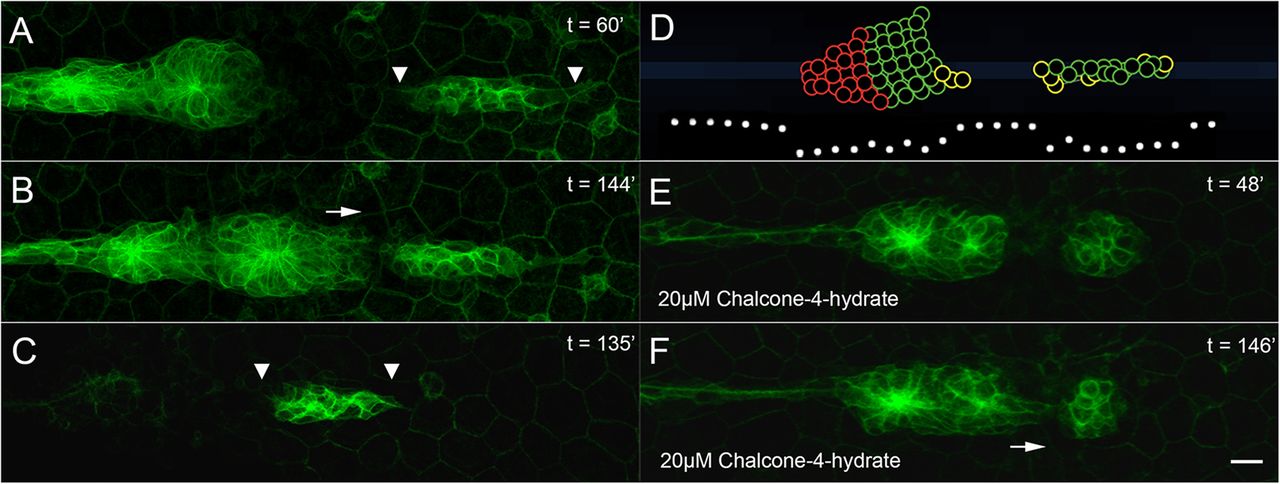
Fig. 3
PLLp morphology following laser ablation. (A) PLLp fragments 60min after ablation to separate leading cells from trailing cells. Arrowheads indicate stretching of the leading fragment. (B) As in A, 144min after ablation. Arrow indicates migration of trailing cells toward leading cells. (C) PLLp 135min after complete ablation of trailing cells. Arrowheads indicate stretching of leading fragment. (D) Model ablation showing cxcr4b (green) and cxcr7b (red) turtles. White dots indicate the levels of Cxcl12a along the midline. (E) PLLp fragments 90min after ablation in the presence of 20μM chalcone-4-hydrate. Leading cells adopt a rounded morphology. (F) Same embryo as in E, 148min after ablation. Arrow indicates migration of trailing cells toward leading cells. Scale bar: 10μm.