
|
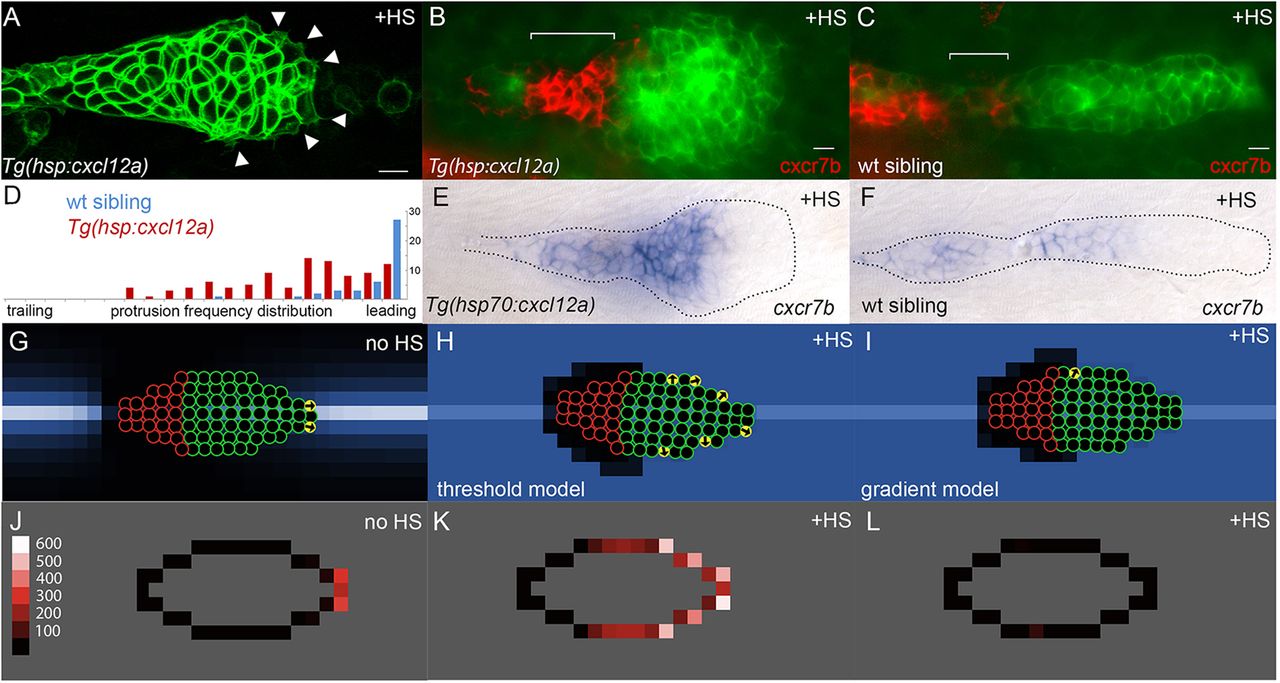
Fig. 2
Experimental and simulated overexpression of Cxcl12a. (A) Morphology of PLLp in Tg(hsp:cxcl12a) after 1h of heatshock (corresponding to t=78 min in supplementary material Movie 1). Arrowheads indicate protrusions. (B,C) False-color overlay of cxcr7b in situ hybridization (red) in Tg(hsp70:cxcl12a) (B) and wild-type sibling embryo (C) after heatshock for 1h and recovery for 2h. (D) Frequency of protrusions observed from the leading to the trailing end of the PLLp in embryos with heatshock-induced cxcl12a expression (red bars, six embryos) compared with that in control siblings (blue, six embryos). Each bar represents the frequency of protrusions observed in 5% increments of the relative distance from the leading end of the PLLp observed. (E,F) In situ hybridization for cxcr7b transcript in Tg(hsp:cxcl12a) (E) and wild-type sibling (F) PLLp after a 30min heatshock at 37.5°C and 4h of recovery. (G) Model PLLp without heatshock. (H) Model PLLp after heatshock when turtles are migrating in response to above-threshold levels of Cxcl12a. (I) Model PLLp after heatshock when turtles are migrating in response to the gradient of Cxcl12a. (J-L) Time-averaged position of actively migrating turtles within model PLLp for the conditions in G-I, respectively. Scale (‘protrusions’/1000 model iterations) is in J. Scale bars: 10μm.