
|
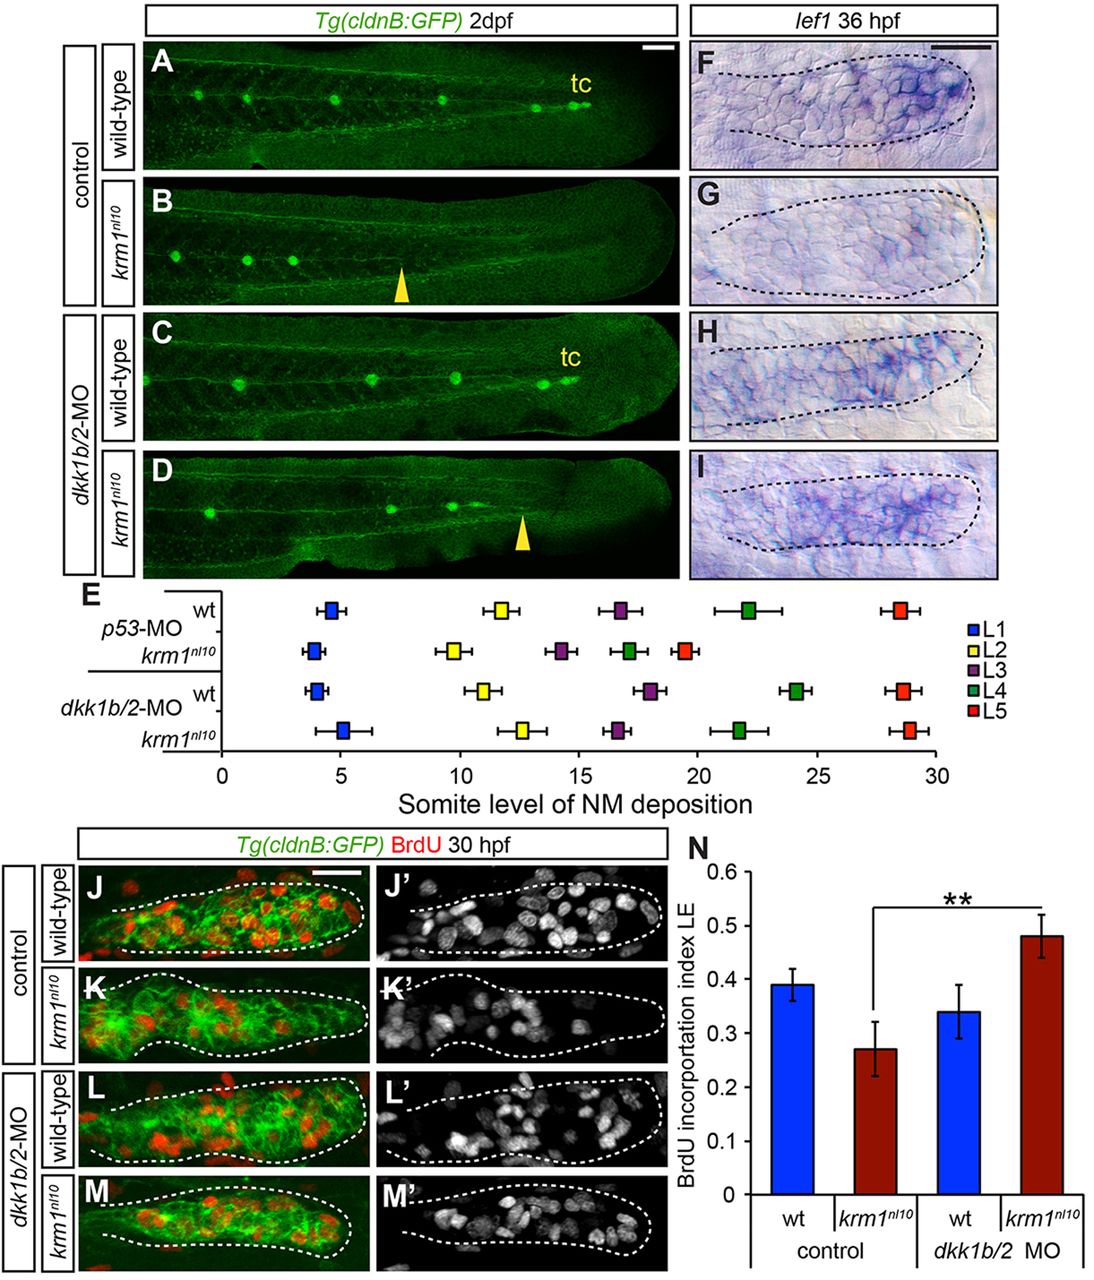
Fig. 7
dkk1b/2 morpholino injections rescue krm1nl10 pLL formation. (A-D) Confocal projection of 2dpf Tg(cldnB:GFP) WT or krm1nl10 embryos, injected with either control or dkk1b/2-MOs. (A) Control WT embryos show full pLLP migration and tc formation. (B) Control krm1nl10 embryos display characteristic premature stalling of the pLLP (yellow arrowhead). (C) Injection of dkk1b/2-MOs in WT embryos results in full pLLP migration and tc formation, although NM spacing is shifted posteriorly. (D) In krm1nl10 mutants injected with dkk1b/2-MOs, pLLP migration and pLL formation are partially rescued (yellow arrowhead). (E) NM spacing in krm1nl10 mutants injected with dkk1b/2-MOs is not significantly different from WT control NMs (n=8 embryos/condition; P<0.001, two-way ANOVA with replication). (F-I) lef1 expression at 36 hpf is restricted to the pLLP leading region in control WT pLLP (F) and downregulated in control krm1nl10 mutant pLLP (G). dkk1b/2-MO injection results in an expansion of lef1 expression in both WT (H) and krm1nl10 (I) primordia. (J-M2) Confocal projections of BrdU incorporation in both WT and krm1nl10 control and dkk1b/2-MO-injected embryos at 30 hpf. BrdU incorporation index is high in the leading region of control WT embryos (J,J2,N) and significantly decreased in krm1nl10 mutants (K,K2,N). dkk1b/2-MO injection results in no change in WT (L,L2,N) and in a significant increase in the BrdU incorporation index in the leading region of krm1nl10 mutant primordia (M,M2,N) (n=10 embryos per condition; **P=0.007, Student′s t-test). Scale bars: 20 μm.