
Image
|
Figure Caption
Fig. S2
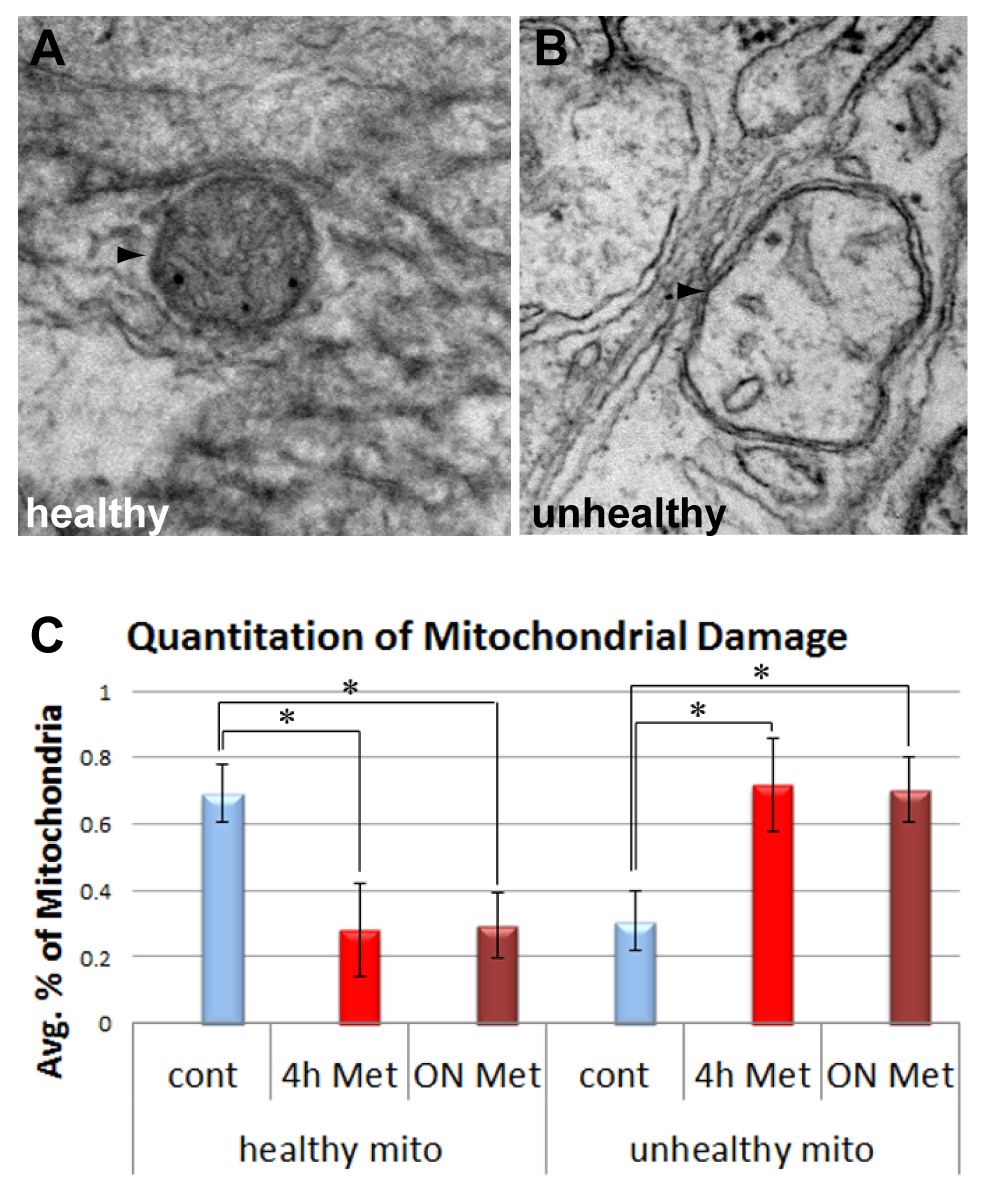
Met treatment increases mitochondrial damage in axons. TEM images show examples of healthy (A) and unhealthy (B) mitochondria (arrowheads) present in EM sections of control or treated vagal nerve bundles. Mitochondria were scored and the percentage of mitochondria found as healthy or unhealthy is shown in panel C (number of mitochondria evaluated: untreated controls, n = 82; 4 hr treatment n = 52, 18 hr treatment n = 88, number of fish examined per group ranged from 3–6).
Figure Data
Acknowledgments
This image is the copyrighted work of the attributed author or publisher, and
ZFIN has permission only to display this image to its users.
Additional permissions should be obtained from the applicable author or publisher of the image.
Full text @ PLoS One