IMAGE

Fig. 8

ID
ZDB-IMAGE-141023-30
Genes
Source
Figures for Pope et al., 2014
Image
Figure Caption

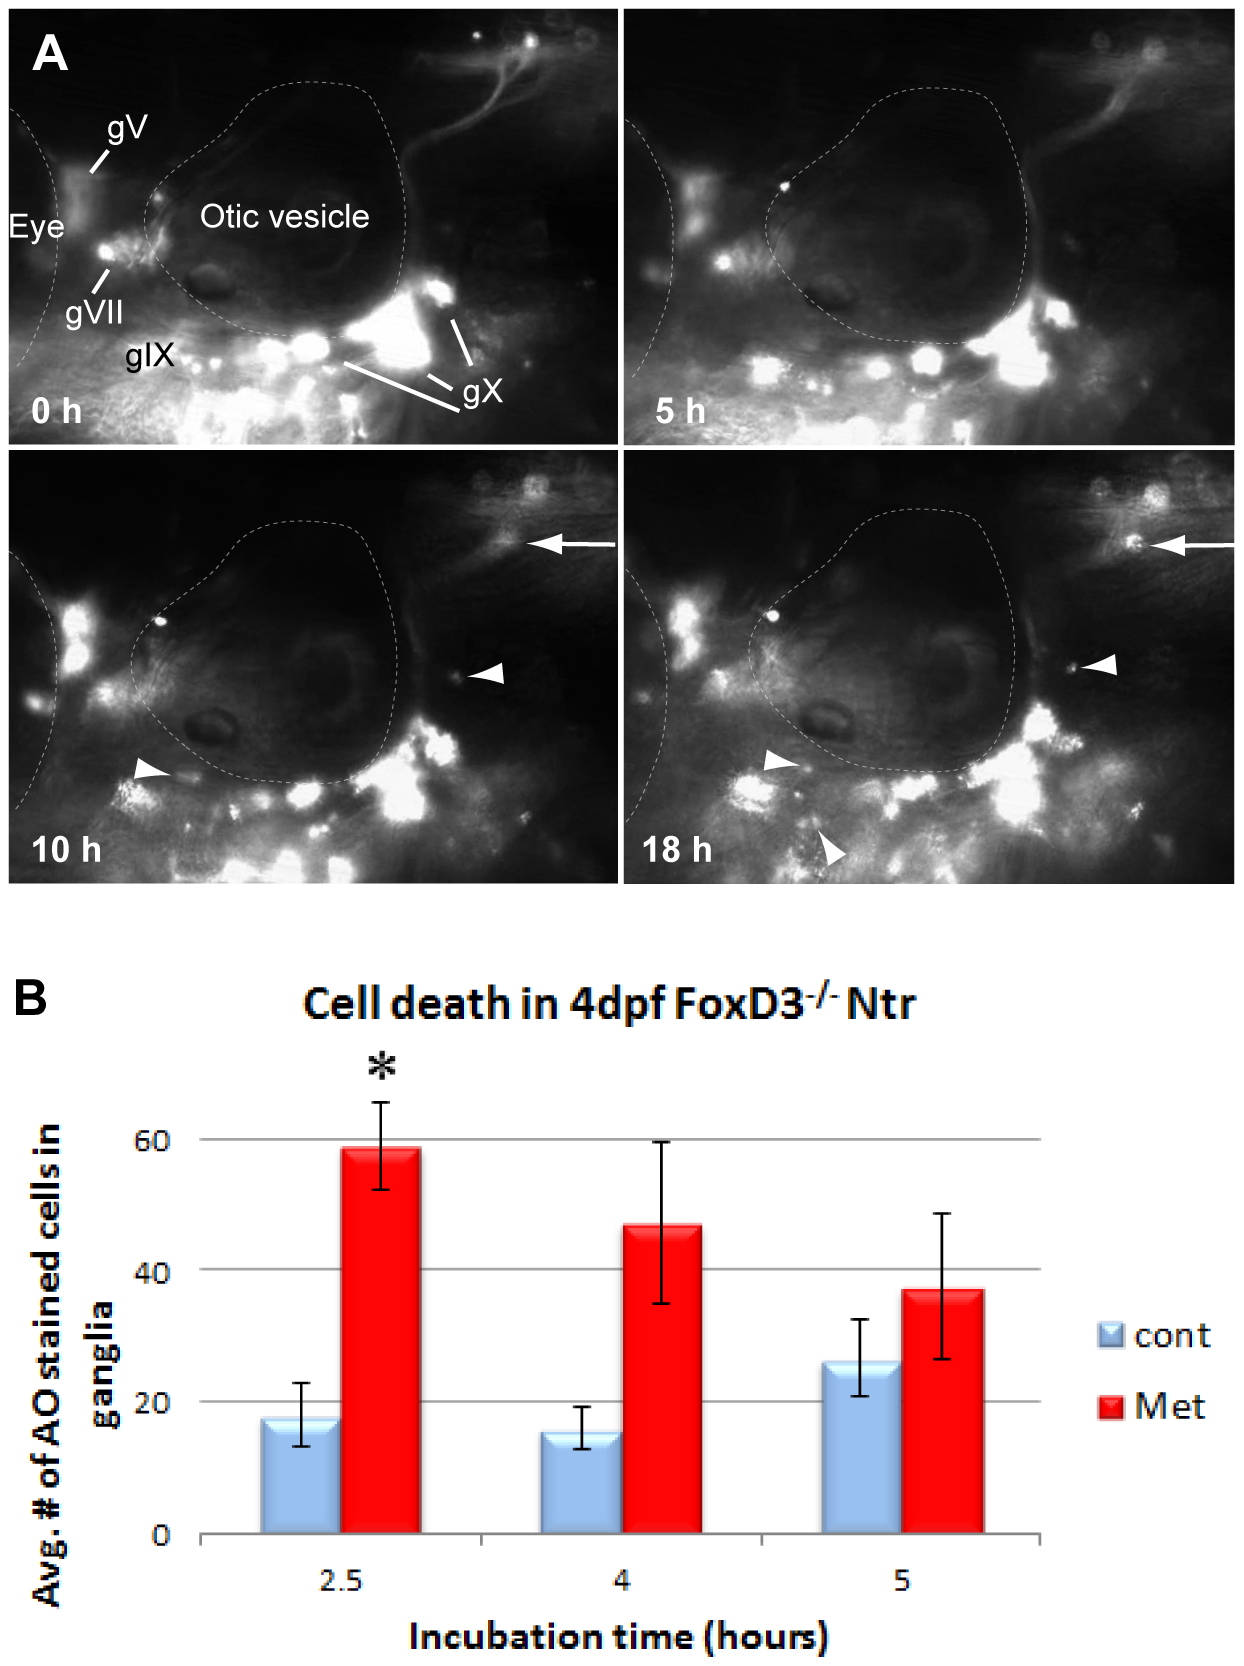
Fig. 8 Inflammatory response in the absence of peripheral glia.

A) Select images from a time lapse video of 4 dpf FoxD3-/-;Ntr treated with 10 mM Met for 18 h. Puncta around plexus (arrows) and red motile cells (arrowheads) appeared around 10 h after start of Met treatment. For comparison, wild type Ntr larvae developed puncta after 2–4 hr in Met (Figure 1B′). B) Quantitation of cell death in 4 dpf Met-treated FoxD3-/-Ntr compared to untreated FoxD3-/-;Ntr. AO-stained cell counts after various incubation times in 10 mM Met. There was a significant increase in cell death after 2.5 hour Met incubation (control 18.00±4.96, n = 9 and Met 59.06±6.66, n = 16, p<0.05), but not after 4 h (control 16.0±3.1 cells, n = 5 and Met 47.3±12.3, n = 6, ns) or 5 h (control 26.6±6.0 cells, n = 5 and Met 37.6±11.0, n = 5, ns) Met treatment. For all panels, anterior is to the left; dorsal is at the top. Eye and otic vesicle (OV) are outlined. Cranial ganglia labeled gV, gVII, gIX and gX in panel A.

Figure Data
Acknowledgments
This image is the copyrighted work of the attributed author or publisher, and ZFIN has permission only to display this image to its users. Additional permissions should be obtained from the applicable author or publisher of the image. Full text @ PLoS One