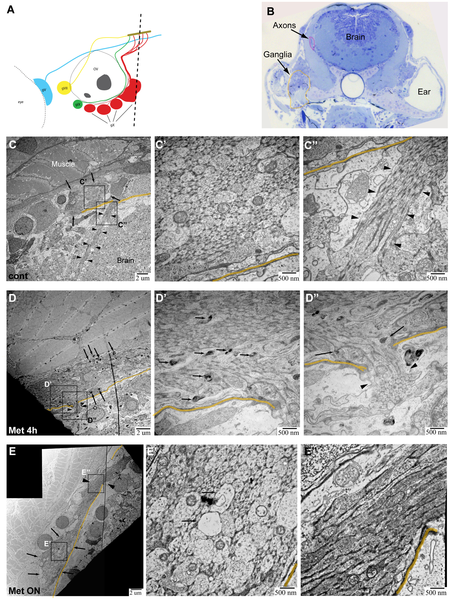
IMAGE

Fig. 4

ID
ZDB-IMAGE-141023-26
Source
Figures for Pope et al., 2014
Image
Figure Caption

Fig. 4 TEM images of axons in Ntr larvae.

A) Diagram of ganglia and axons. Dotted line indicates location of transverse sections in 4 or 5 dpf larvae. B) Representative Toluidine Blue (TB) stained transverse section shows location of axons (magenta) and ganglia (orange) in 5 dpf larvae. C,C′,C′′) 5 dpf untreated Ntr. C) Cross section of axon bundle (arrows) and longitudinal view of axons (arrowheads) entering hindbrain (6000x). Boundary between brain and periphery (basement membrane) indicated in orange in all images. C′) Cross section of axons (30,000x). Small and medium diameter axons are visible. C′′) Longitudinal view of parallel axons entering brain (arrowheads) (30,000x). D,D′,D′′) 4 dpf Ntr treated with 10 mM Met for 4 h. D) Cross section of axon bundle and longitudinal view of axons (arrowheads) entering hindbrain (7500x). Electron-dense puncta (arrows) are seen at this magnification. D′) Cross section of axon bundle (30,000x). Damaged axons containing dark puncta (arrows). D′′) Axons entering brain (arrowheads) show dark puncta (arrows) (30,000x). E,E′,E′′) Ntr at 5 dpf after 18 hr-treatment with 10 mM Met. E) Cross section of axon bundle (arrows) and longitudinal view of axons (arrowheads) entering hindbrain (7500x). E′) Cross section of axon bundle (30,000x). Individual axons (arrows) appear empty and have few microtubules and neurofilaments. E′′) Axons entering brain (30,000x) appear darker and are more electron-dense than control axons (compare to C′′).

Figure Data
Acknowledgments
This image is the copyrighted work of the attributed author or publisher, and ZFIN has permission only to display this image to its users. Additional permissions should be obtained from the applicable author or publisher of the image. Full text @ PLoS One