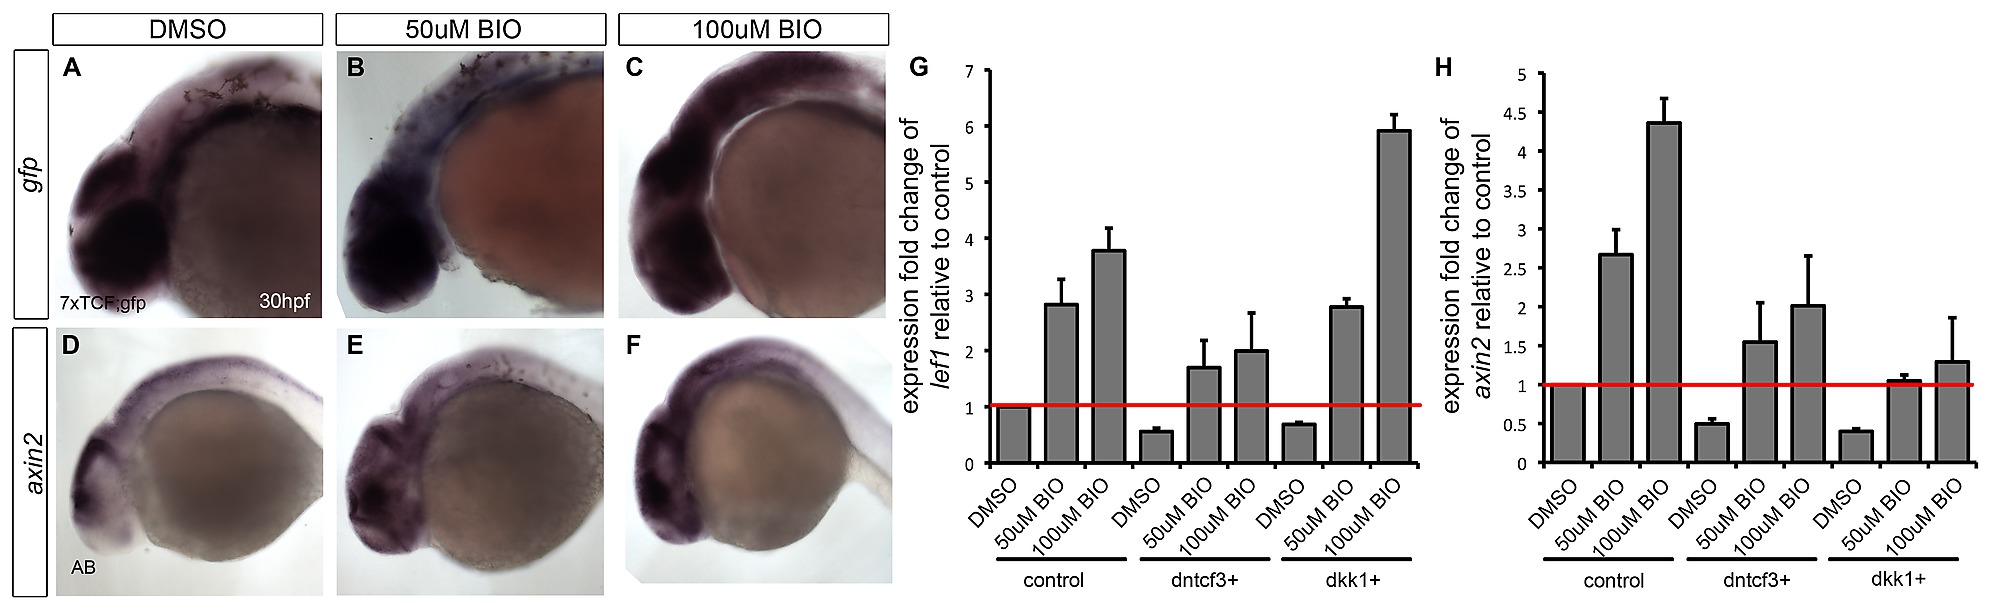
IMAGE

Fig. S3

ID
ZDB-IMAGE-141023-15
Source
Figures for Alexander et al., 2014
Image
Figure Caption

Fig. S3

BIO rescues expression of Wnt targets in dntcf3+ and dkk1+ embryos. (A–F) Whole mount ISH for gfp (A–C) and axin2 (D–F) at 30 hpf in embryos treated with DMSO, 50 µM BIO, and 100 µM BIO for 6 hours at 24 hpf. With increasing concentrations of BIO, 7xTCF:GFP embryos show an increase in ectopic gfp expression, particularly throughout the brain (B,C), Similarly, axin2 expression expands in a dose-dependent manner (E,F). (G–H) qPCR analysis for Wnt targets lef1 (G) and axin2 (H) in control, dntcf3+, and dkk1+ embryos treated with DMSO, 50 µM BIO, and 100 µM BIO for 6 hours at 2 hphs. Red line indicates normalized expression levels in DMSO treated non-transgenic controls with ef1alpha as an internal control. BIO induces expression of Wnt targets in non-transgenic controls and rescues expression in dntcf3+ and dkk1+ embryos (G,H).

Acknowledgments
This image is the copyrighted work of the attributed author or publisher, and ZFIN has permission only to display this image to its users. Additional permissions should be obtained from the applicable author or publisher of the image. Full text @ PLoS Genet.