
|
Fig. 7
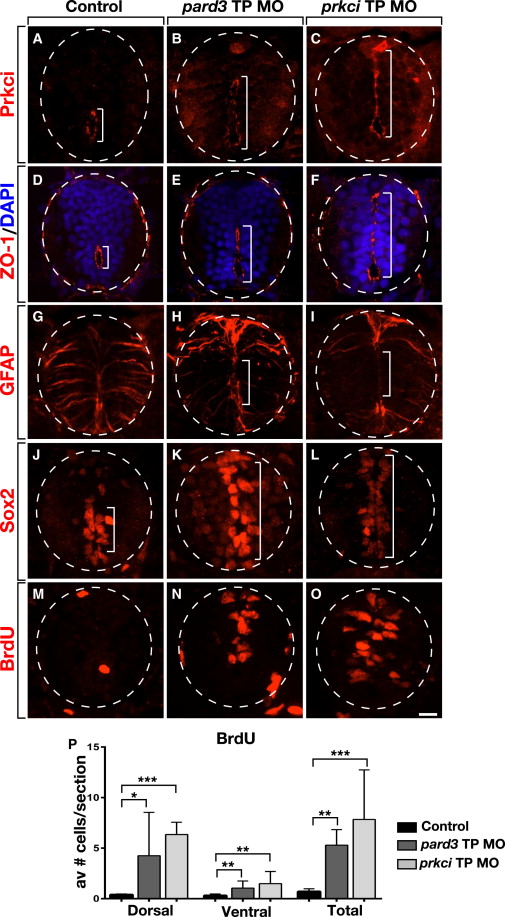
Blocking miR-219 Access to pard3 or prkci 32 UTRs Phenocopies miR-219 Loss of Function
All panels show representative images of spinal cord transverse sections with dorsal up.
(A–C) Larvae (3 dpf) labeled to detect Prcki localization. In the control, Prkci is limited to a small central canal (A). By contrast, Prkci extends dorsally in pard3 TP MO and prkci TP MO-injected larvae, marking a primitive lument (B and C).
(D–F) Similarly to Prcki, ZO-1 is restricted to a central canal in the control larva (D) but extends more dorsally in pard3 TP MO and prkci TP MO-injected larvae (E and F).
(G–I) pard3 TP MO and prkci TP MO-injected larvae have fewer medial spinal cord radial glia than control.
(J–L) pard3 TP MO and prkci TP MO-injected larvae have more Sox2+ cells in dorsal spinal cord than control.
(M–O) BrdU incorporation at 3 dpf. TP MO-injected larvae have more labeled cells than control.
(P) Graph showing number of BrdU+ cells in dorsal, ventral, and entire spinal cord. Data represent ± SEM (n = 10 larvae for each experiment, five to ten section per larva). p < 0.05, p < 0.005, p < 0.0005, unpaired t test. Scale bar equals 10 µm.
See also Figure S2.
Reprinted from Developmental Cell, 27(4), Hudish, L.I., Blasky, A.J., and Appel, B., miR-219 Regulates Neural Precursor Differentiation by Direct Inhibition of Apical Par Polarity Proteins, 387-398, Copyright (2013) with permission from Elsevier. Full text @ Dev. Cell