
|
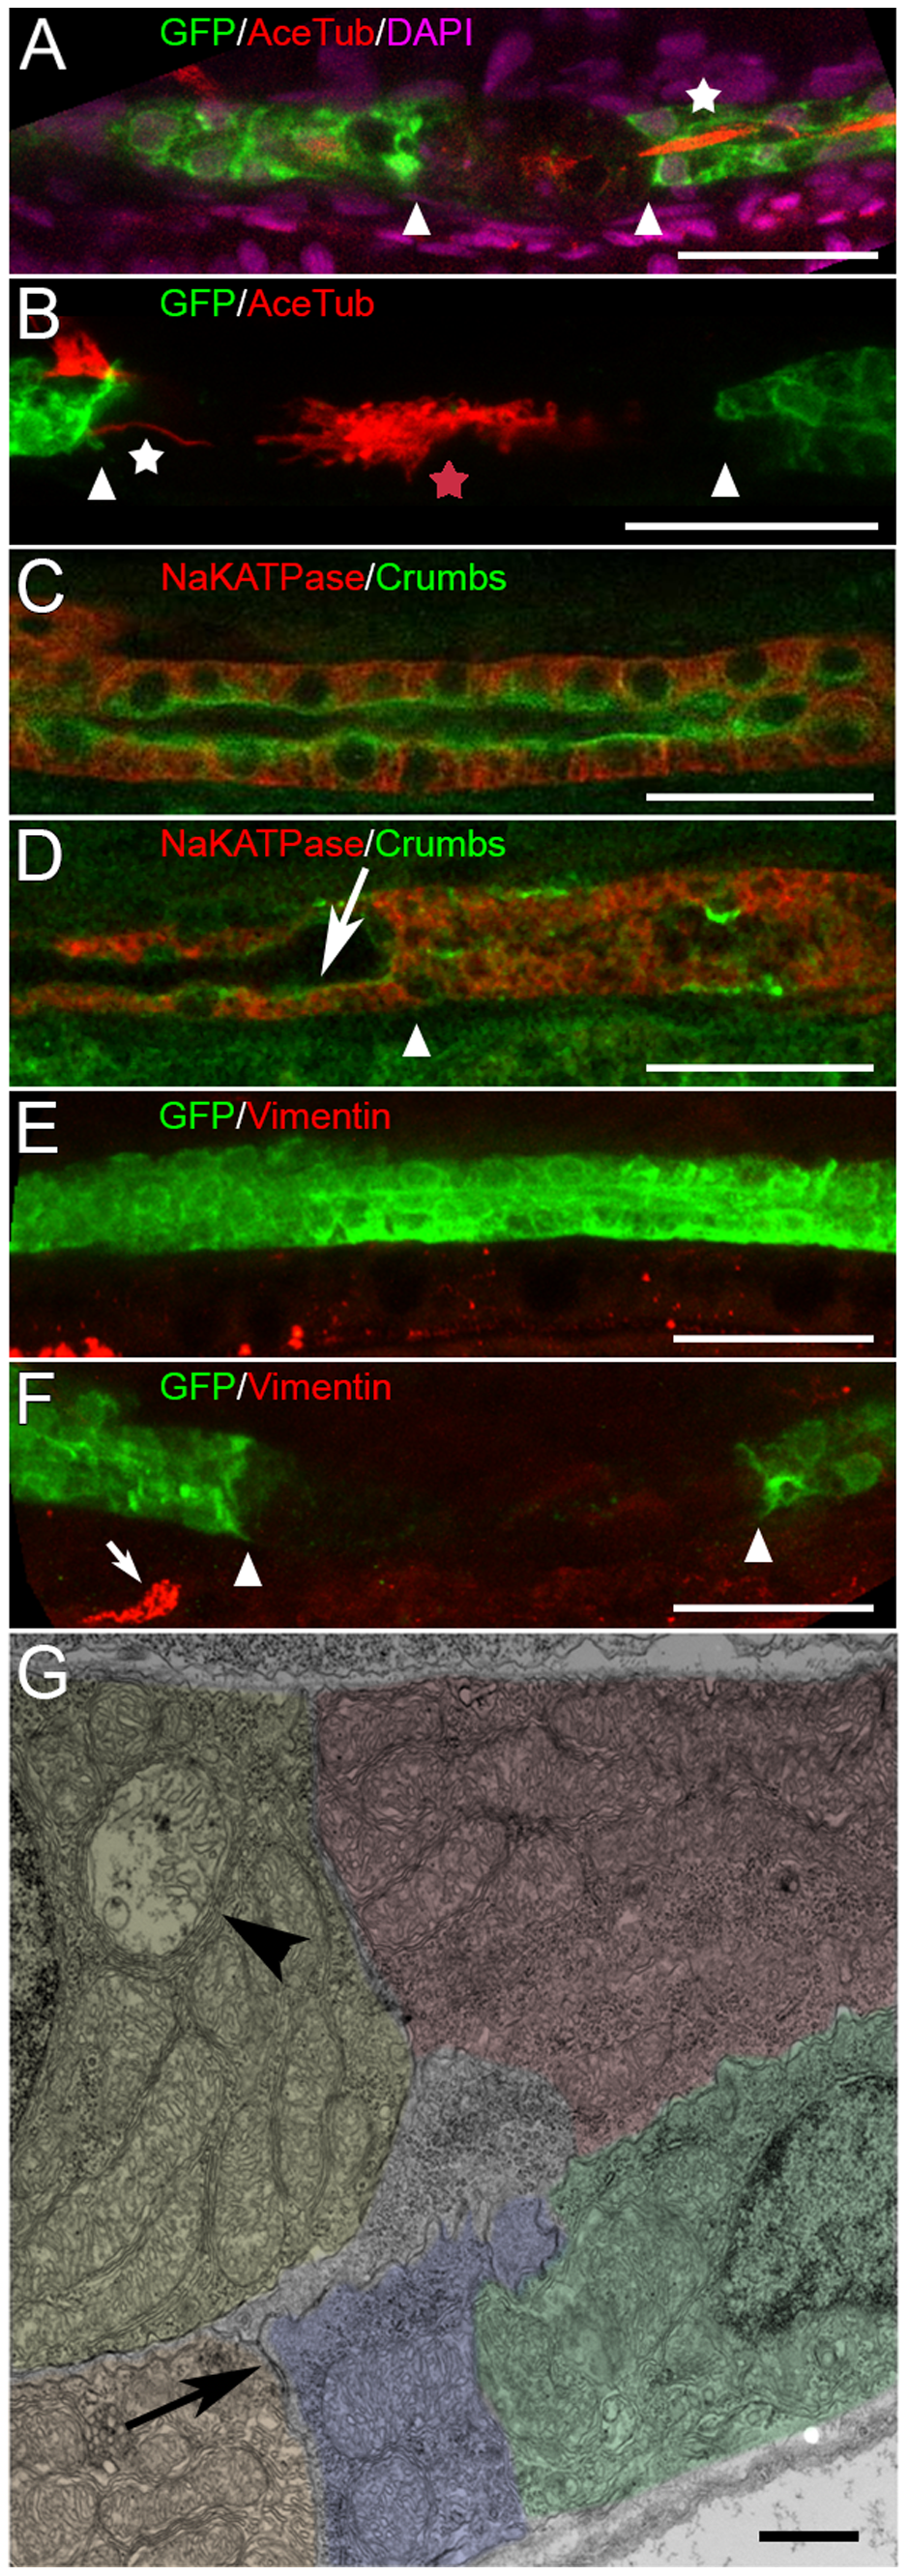
Fig. 3
Regenerating epithelia remain differentiated.
Kidney epithelium is shown at 4–6 hours post injury (hpi), on the site of the laser ablation. (A, B): Anti-GFP (green), anti-acetylated-tubulin (red) and DAPI (magenta, A) staining of the injured tubule shows that cilia and cilia bundles (multiciliated cell in A) are present at the edge (white arrowheads, also Figure S4) of surviving epithelium (white star in A and B). The aggregated cilia bundles in B (red star) are visible in the middle of the injured segment (between arrowheads). (C and D): Na/K ATPase (red) and Crumbs (green) expression in intact (C) and injured (D) epithelium (also Figure S4). AKI does not affect the expression of Crumbs on the apical surface of surviving cells (D, arrow), while its distribution is randomized in the injured segment (right of the arrowhead in D, which marks the border between the intact and the injured segment. (E, F): Vimentin is not expressed in intact kidney epithelium (E) and is not up-regulated after acute injury (F, also Figure S4). Vimentin staining can be seen outside of the kidney (arrow in (F)). Bar lengths in (A-F) are 30 µm. (G) Electron microscopy of a longitudinal section at the edge of surviving epithelium (the edge itself is not shown, to the left). Apical junctional complexes (arrow) are preserved. Bar length is 1 μm. One degenerated mitochondrion indicates partial injury to the cell at the edge of the injury (arrowhead). Different colors are used to delineate individual epithelial cells. The virtual slice thickness in (A-F): A- 1.4 μm; B-5.6 μm (7 slices); C,D- 1.4 μm; E- 7.0 μm (8 slices); F- 11.2 μm (15 slices).