
|
Fig. 2
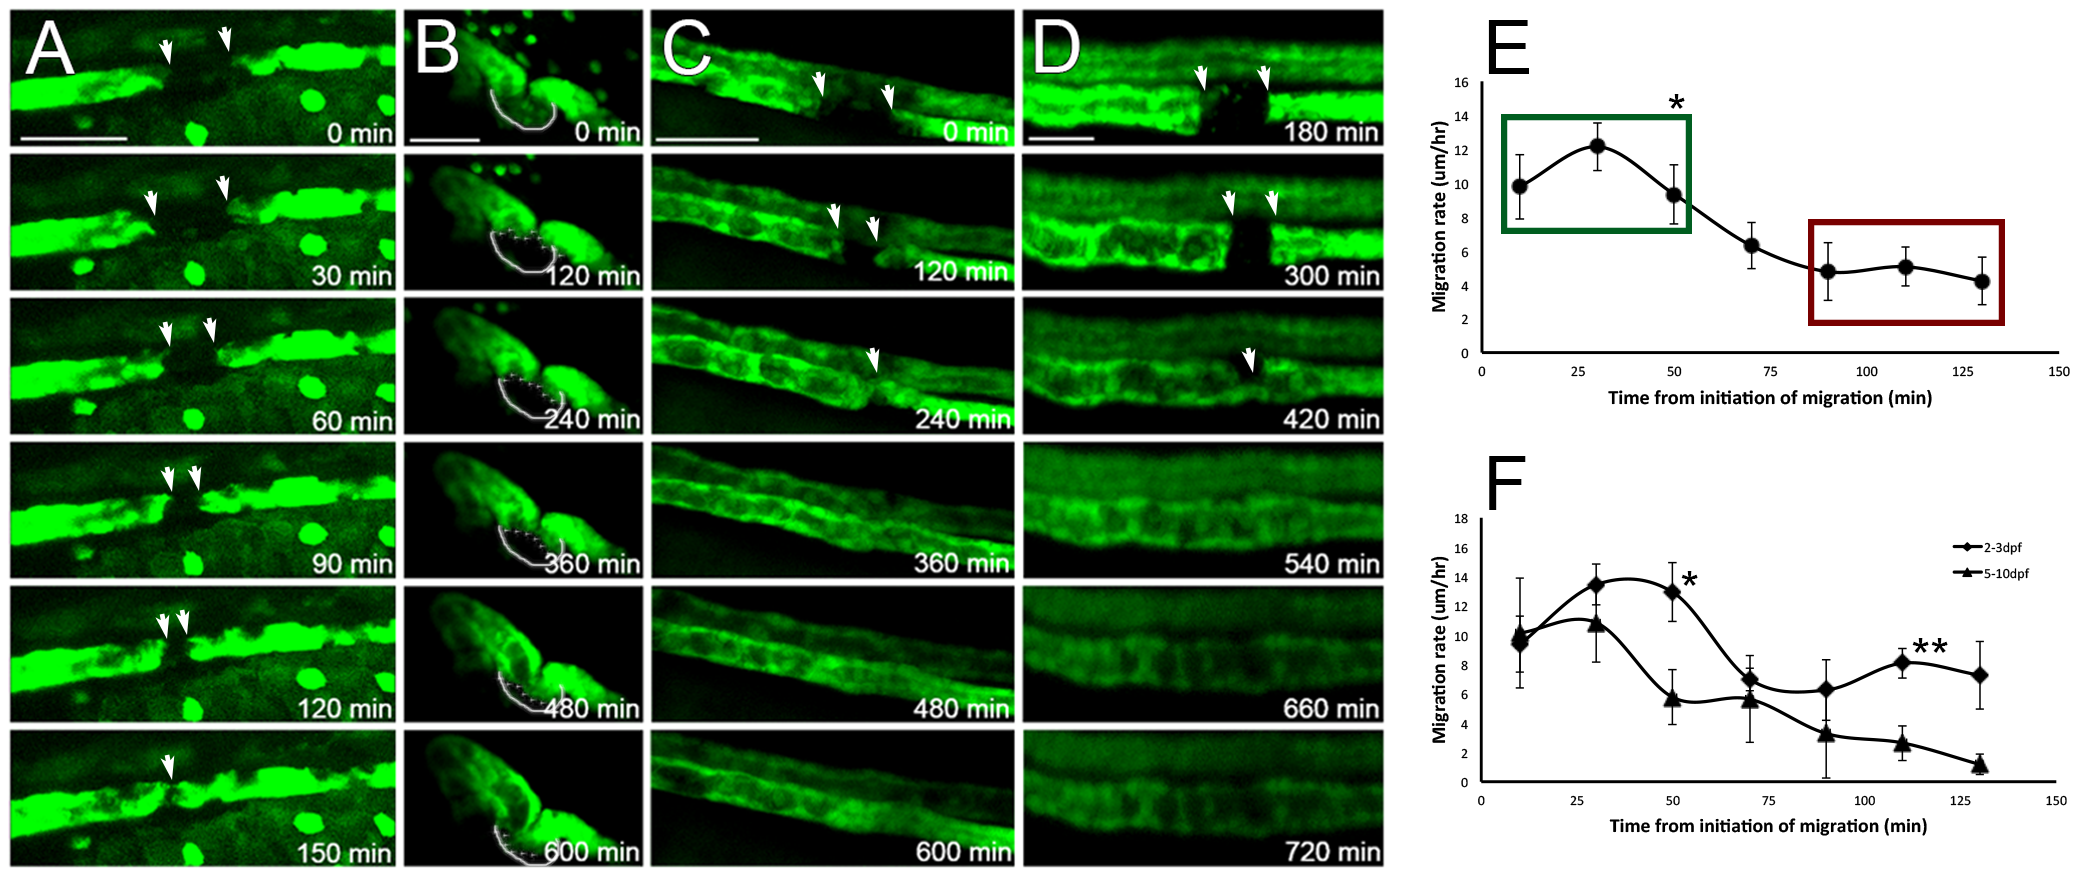
Surviving kidney epithelium responds by collective migration.
Various kidney GFP transgenics were examined by time lapse confocal microscopy at different developmental stages. (A) Proximal tubule epithelium (ET33d10 transgenic, 2.5 dpf), after segmental ablation of the proximal tubule, shown in 30 min intervals. Scale bar –60 μm. (B) Proximal convoluted tubule epithelium (ET33d10 transgenic, 6 dpf), after segmental ablation of the proximal tubule, shown in 120 min intervals. Scale bar –60 μm. (C, D) Distal tubule epithelium (ET11-9 transgenic) after segmental photoablation shown in 120 min intervals in 7 dpf (C) and 5 dpf (D) fish. (D) shows marked obstructive dilatation of tubule epithelium, some of which is also seen in (C). This is a commonly observed phenomenon. Scale bars: (C) - 60 μm, (D) - 30 μm. (E) Migration rates as a function of time after the initiation of the migratory response. The rates are maximal right after the initiation of the migration and decrease over a few hours. The three early time points (green box) show statistically significant difference from the three late time points (red box, p<0.01, n = 10). The initial migration rates are similar in young (2–3 dpf) fish and older (> = 5 dpf) fish (p = 0.84), but the rates appear to persist longer in younger fish. Statistically significant differences between the rates can be seen at 50 min (p = 0.02, n = 5,5) and 110 min (p<0.01, n = 5,5) time points, as shown in (F).