
|
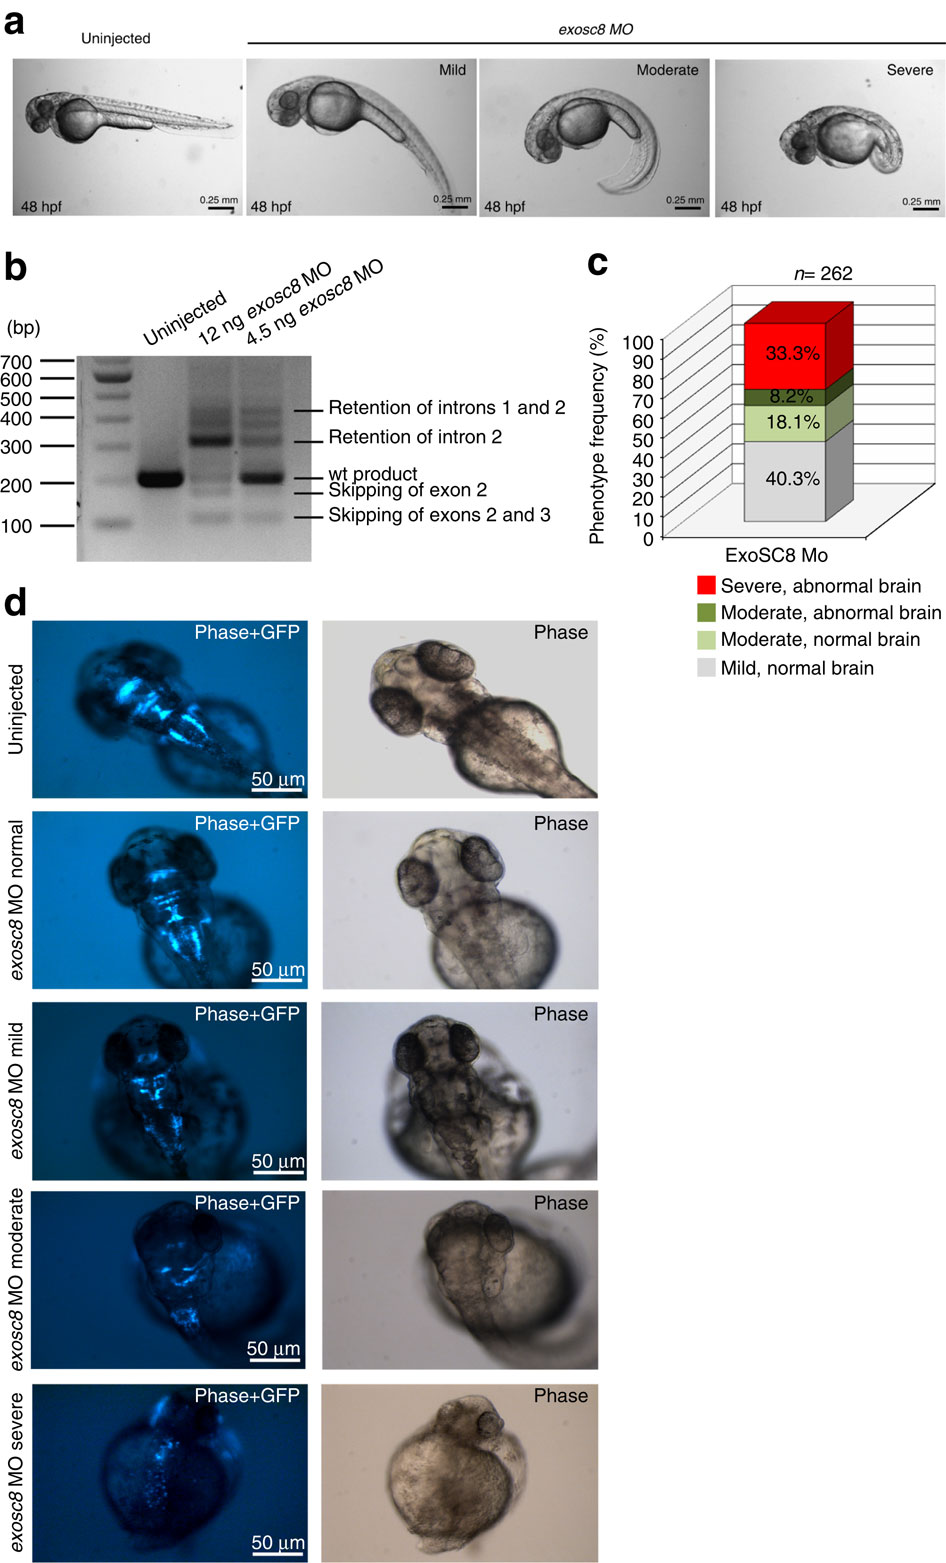
Fig. 6
(a) Morphology of live embryos at 48 hpf injected with 12 ng splice-blocking exosc8 antisense MO at the 1–2 cell stage. From left to right: un-injected control embryo, exosc8 MO injected mild, moderate and severe phenotype, respectively. Mild phenotype: slightly curved tail; moderate phenotype: C-shaped; severe category: abnormally formed, very short tail, cardiac oedema, and small, misshapen or missing eyes. (b) RT–PCR analysis: analysis of exosc8 transcripts from embryos injected with the splice-blocking exosc8 MO which targets the splice donor site of exon 2. Using primers in exons 1 and 4, RT–PCR yielded several additional bands in MO injected embryos originating from mis-spliced transcripts. Wild-type transcript is still present in embryos injected with 4.5 ng of MO, but only a trace of wild-type product is left in embryos injected with 12 ng of MO, therefore 12 ng of MO was used in subsequent experiments. wt, wildtype. (c) Relative distribution of the exosc8 morphant phenotypes described above. External morphology described in a and cranial nerve abnormalities displayed in panel d are both taken into account in this categorization; exosc8 MO was injected in three independent experiments into embryos of the Tg(islet-1:GFP) strain and a total of 262 MO injected embryos were evaluated by light and fluorescent microscopy. (d) Brain abnormalities of exosc8 morphants (Tg(islet-1:GFP) strain) from the different phenotypes at 48 hpf: dorsal views of GFP positive neurons in the midbrain and the hindbrain. These transgenic zebrafish embryos express GFP in cranial motor and sensory neurons and in the efferent neurons for the lateral line and the vestibule-acoustic nerves. Normal cranial neuron structure and development was detected in embryos of the normal and mild category. Disrupted neuronal structure in the severe and in a proportion of the moderate categories; GFP positive cells are scattered, no clear structures are visible and overall GFP expression is reduced.