
|
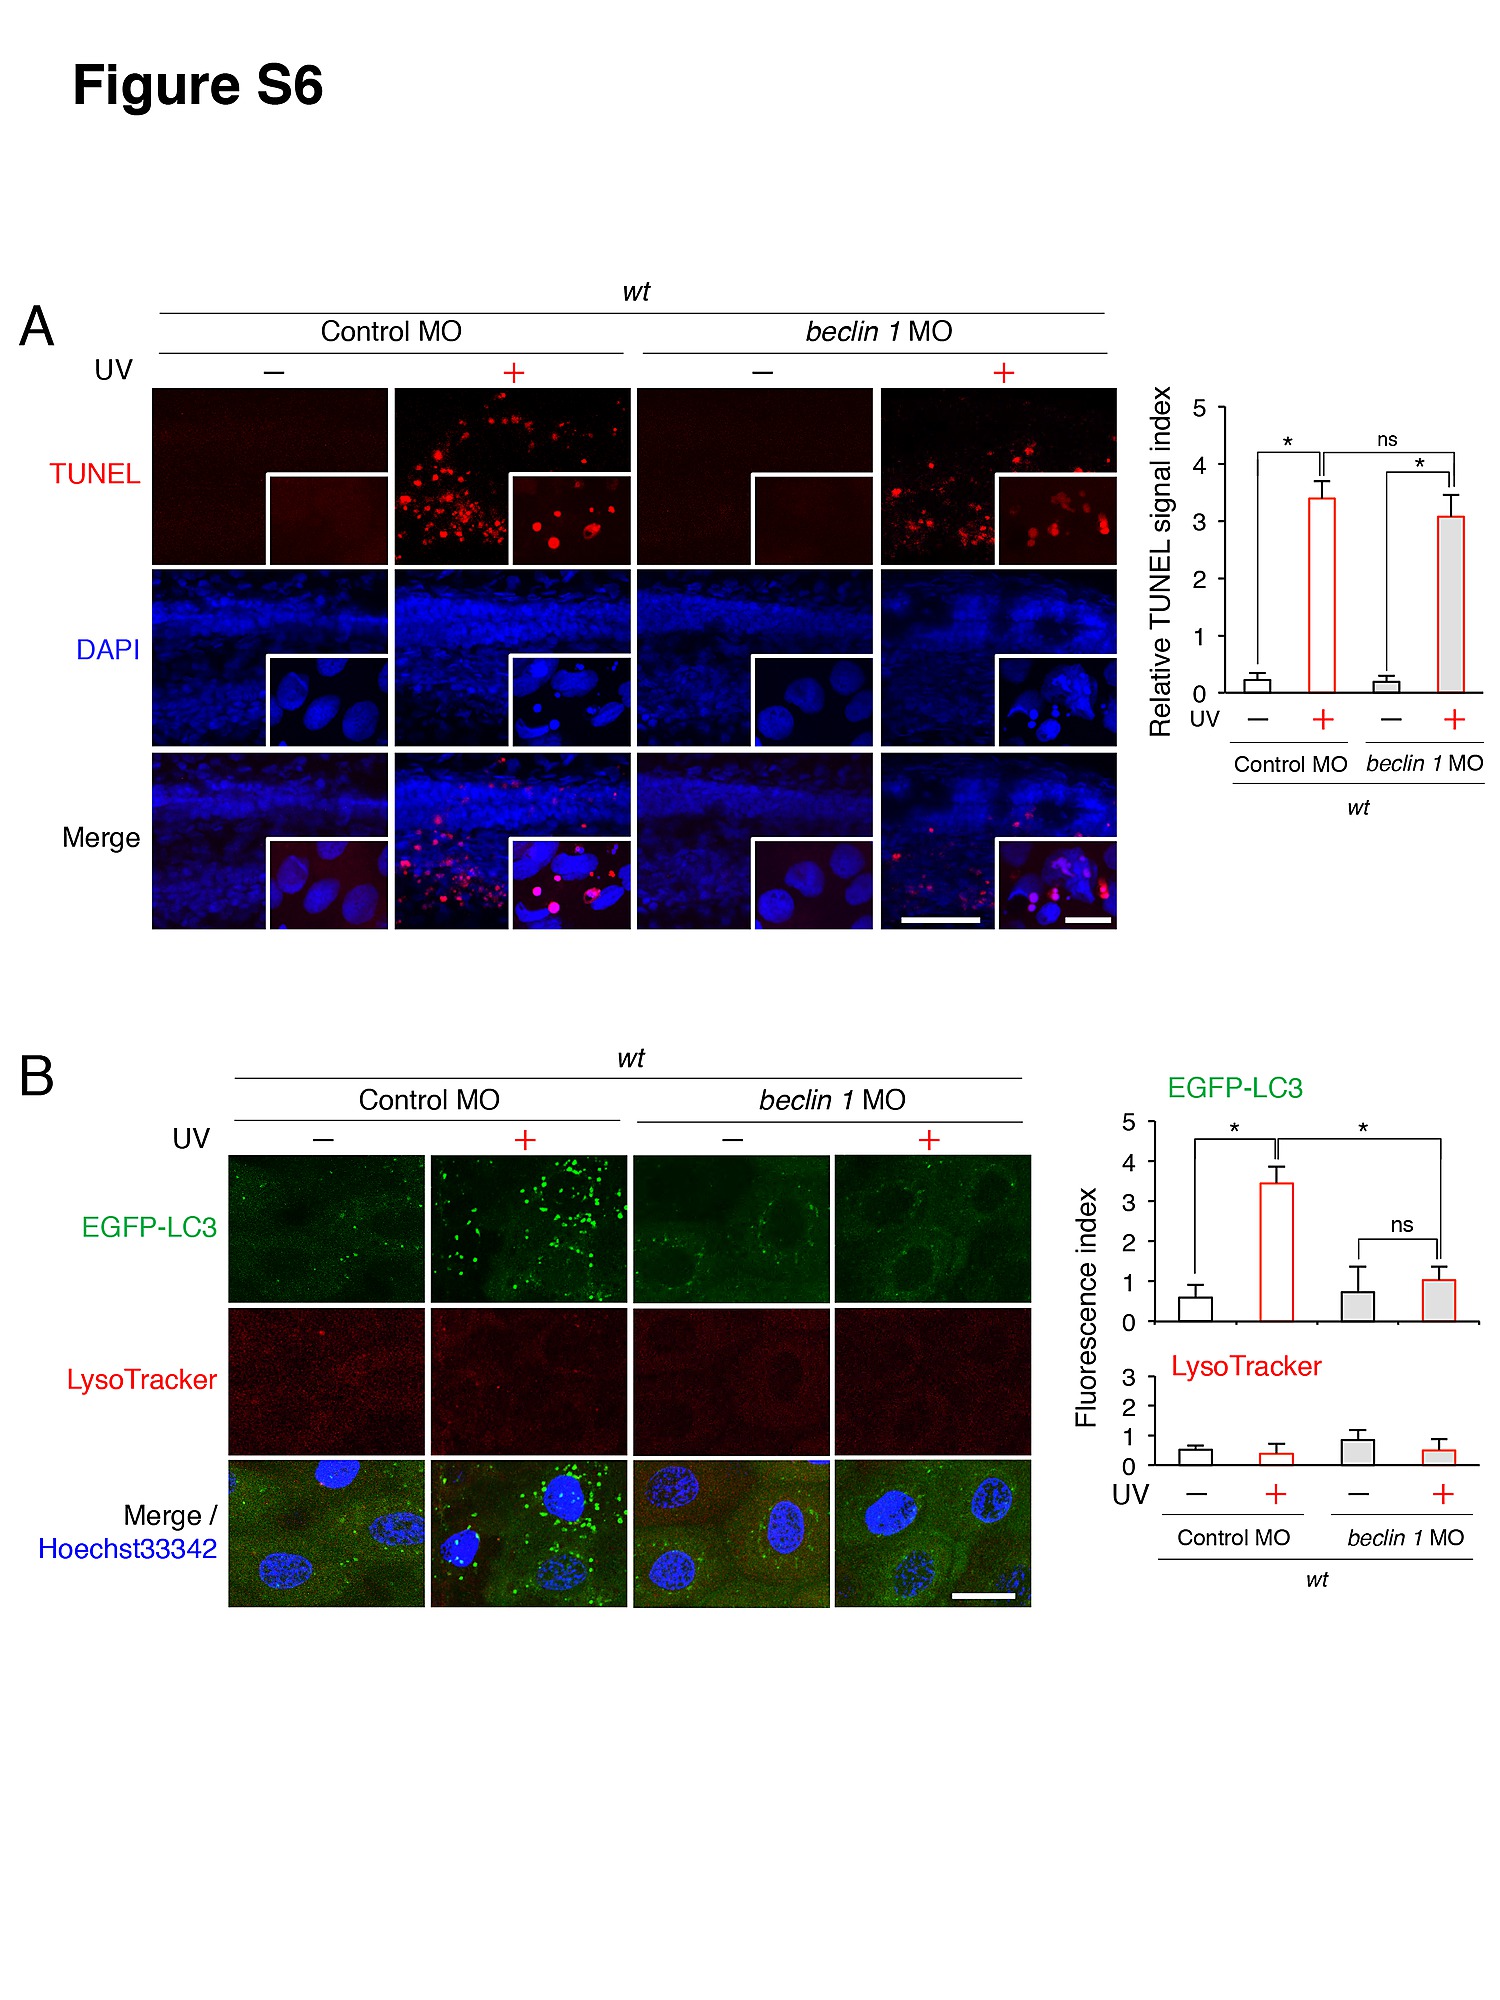
Fig. S6
Impact of the beclin 1 knockdown on UV-induced apoptosis and autophagy. (A) Partial but significant suppression of UV-induced apoptosis in beclin 1 morphants. The UV (18 mj/cm2) treatment was done at 66 hpf, followed by the phenotype observations at 72 hpf. Scale bar in the large image, 250 µm. Scale bar in the inset, 10 μm. Quantification of data presented in A (n = 9) is shown in the right graphs; the number (n) of animals is for each morphant with or without UV treatment. Three independent areas (periderm or basal epidermal cells in the caudal fin) were selected from individual animals. (B) Sufficient suppression of UV-induced autophagy in beclin 1 morphants. The UV (18 mj/cm2) treatment was done at 69 hpf, followed by the phenotype observations at 72 hpf. Scale bar, 10 μm. Quantification of data presented in A (n = 9) is shown in the right graphs; the number (n) of animals is for each morphant with or without UV treatment. Three independent areas (periderm or basal epidermal cells above the eye) were selected from individual animals. Error bars represent the mean ± S.D., **p<0.005; *p<0.05 in (A), and *p<0.005; ns, not significant in (B).