
|
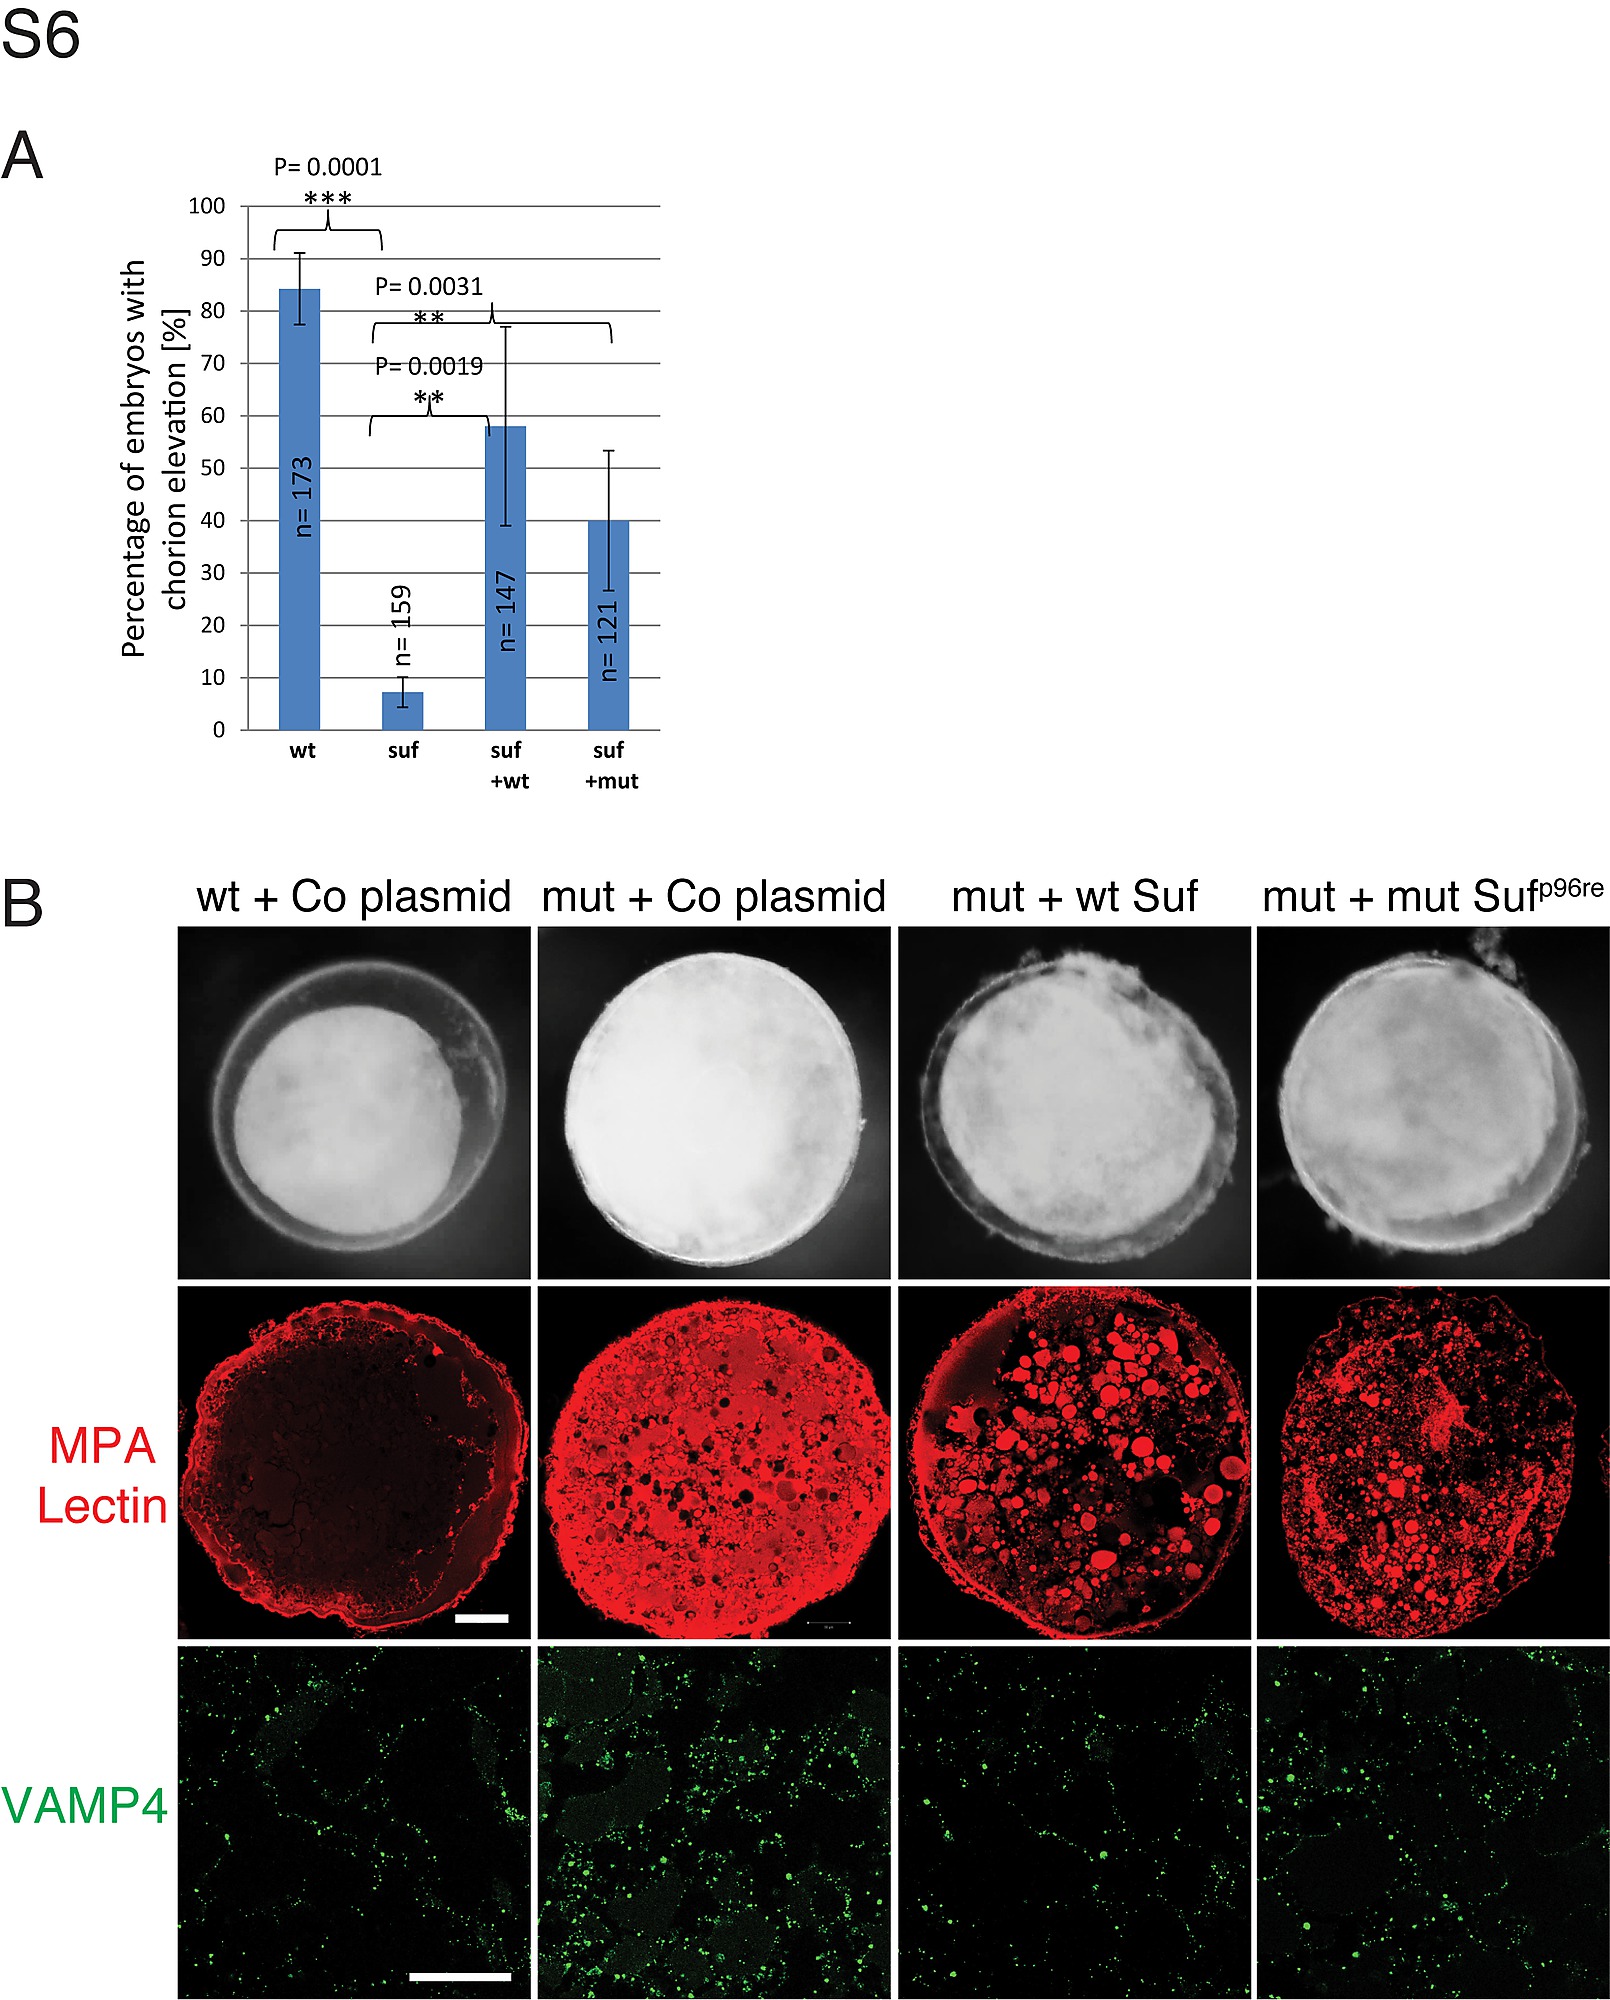
Fig. S6
Rescue of chorion elevation defect. (A) Quantification of plasmid injection experiments in Figure 6 H and I showing the number of oocytes with elevated chorions. Error bars represent standard deviation. (B) Morphological phenotype (upper row) of chorion elevation in activated wt (wt + co plasmid) (100%; n = 55), but not in mut oocytes after injection with control DNA (suf + Co plasmid) (0%; n = 56). Mutant oocytes injected with plasmid encoding wt Suf (mut + wt Suf) (87.5%; n = 56) or mut Sufp96re (mut + mut Sufp96re) (67.9%; n = 53) show chorion elevation. Rescue of MPA-lectin (middle row) and VAMP4 (lower row) accumulation on immature secretory granules after injection of plasmid encoding wt Suf (mut + wt Suf) or mut Sufp96re (mut + mut Sufp96re) into mutant oocytes. Scale bars: 50 μm.