
|
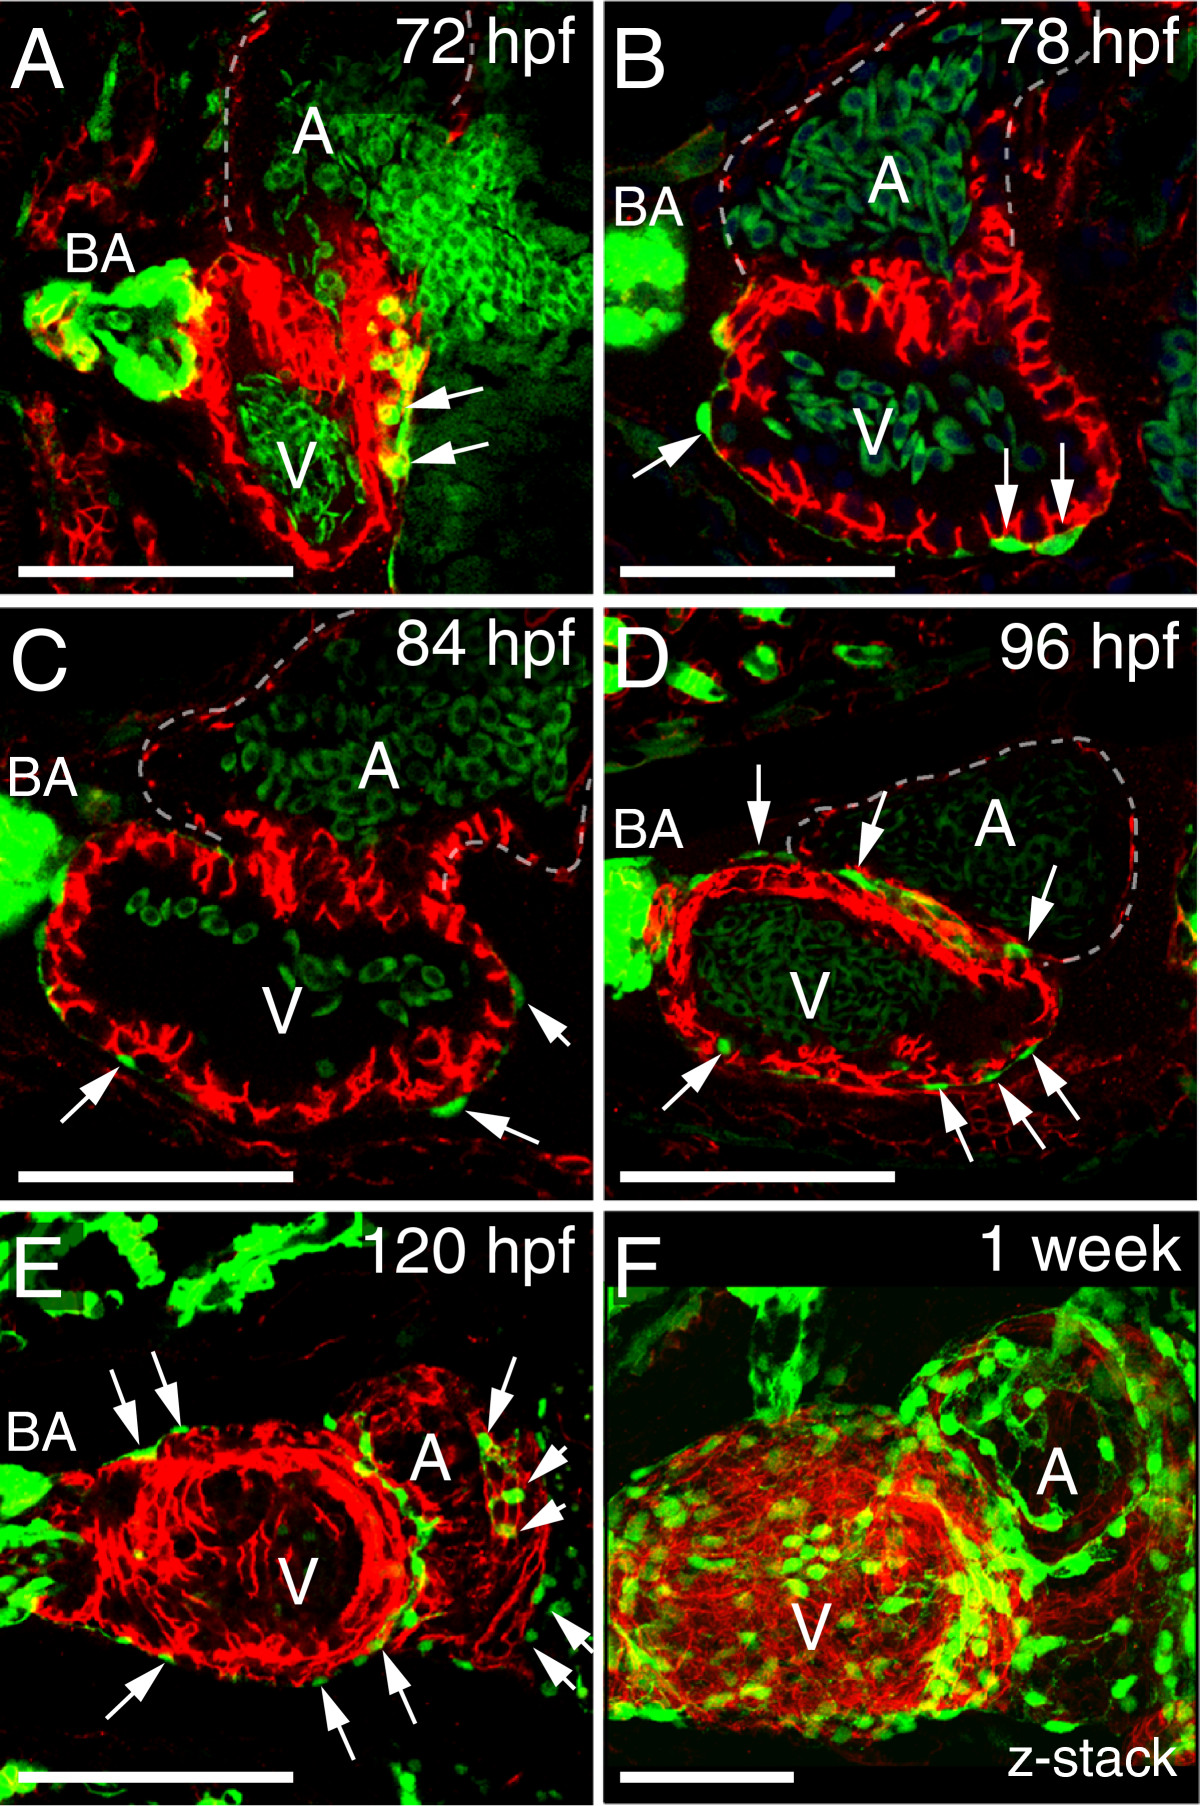
Fig. 4
Normal progression of epicardium formation. Ventral views of zebrafish hearts. (A-F) Epicardial cells are marked with pard3 (EGFP; green) and cardiomyocytes are marked with ALCAM (red). Confocal images from 72-120 hpf are optical slices showing progressive epicardium coverage (white arrows) proceeding across the ventricle (V) and then onto the atrium (A) at 120 hpf. The z-series at one-week shows epicardial cells on the ventricle and atrium, however epicardium coverage is not complete. For all panels, with anterior to the left and BA is bulbus arteriosus. Scale bars = 50 microns. For each time point n = 5.