
Image
|
Figure Caption
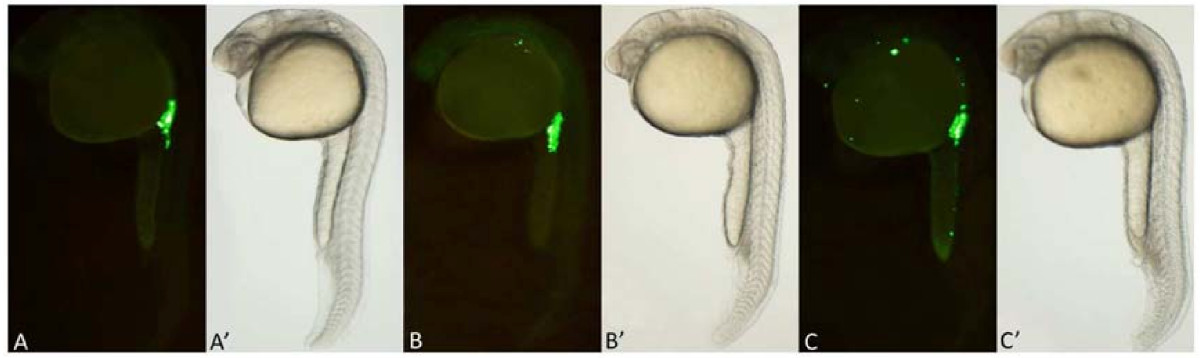
Fig. 1
Fluorescence images of zebrafish PGCs after exposure to various concentrations of EE2. A: In all treatment groups, normal PGCs were observed in the anterior region of the yolk extension at 24 hpf. B: In the 1 ng/L, 10 ng/L, and 100 ng/L EE2 exposure groups, ectopic PGCs were primarily observed along the branchial arch, similarly to the spadetail mutant. C: In the 500 ng/L, 1 μg/L and 2 μg/L EE2 exposure groups, many ectopic PGCs were observed along the branchial arch, on the back, in the abdomen, and along the trunk. A′, B′, and C′: Bright-field views show the morphology of the embryos.
Acknowledgments
This image is the copyrighted work of the attributed author or publisher, and
ZFIN has permission only to display this image to its users.
Additional permissions should be obtained from the applicable author or publisher of the image.
Full text @ Reprod. Biol. Endocrinol.