
Image
|
Figure Caption
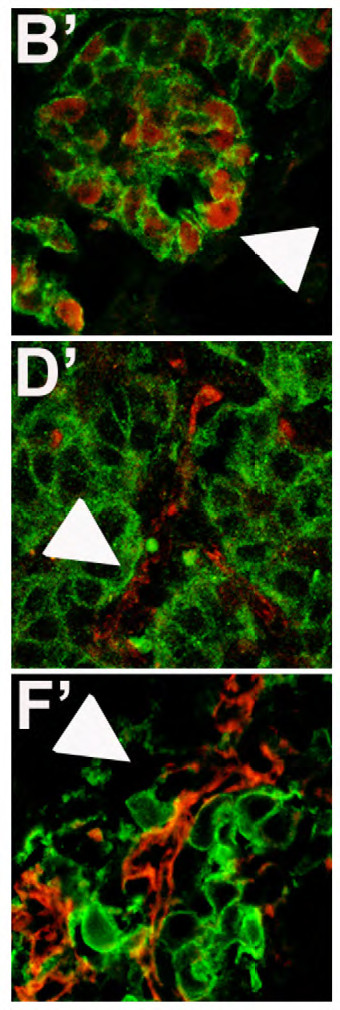
Fig. S3
Cropped images evidenced in white squares of Fig.3 for PCNA (B′), E-Cadherin (D′), N-Cadherin (F′) expression in eGFP positive tumor masses.
Acknowledgments
This image is the copyrighted work of the attributed author or publisher, and
ZFIN has permission only to display this image to its users.
Additional permissions should be obtained from the applicable author or publisher of the image.
Full text @ Dis. Model. Mech.