
IMAGE
Fig. S4
- ID
- ZDB-IMAGE-140902-112
- Publication
- Pinzón-Olejua et al., 2014 - Essential roles of zebrafish rtn4/Nogo paralogues in embryonic development
- All Figures
- Figures for Pinzón-Olejua et al., 2014
Image
|
Figure Caption
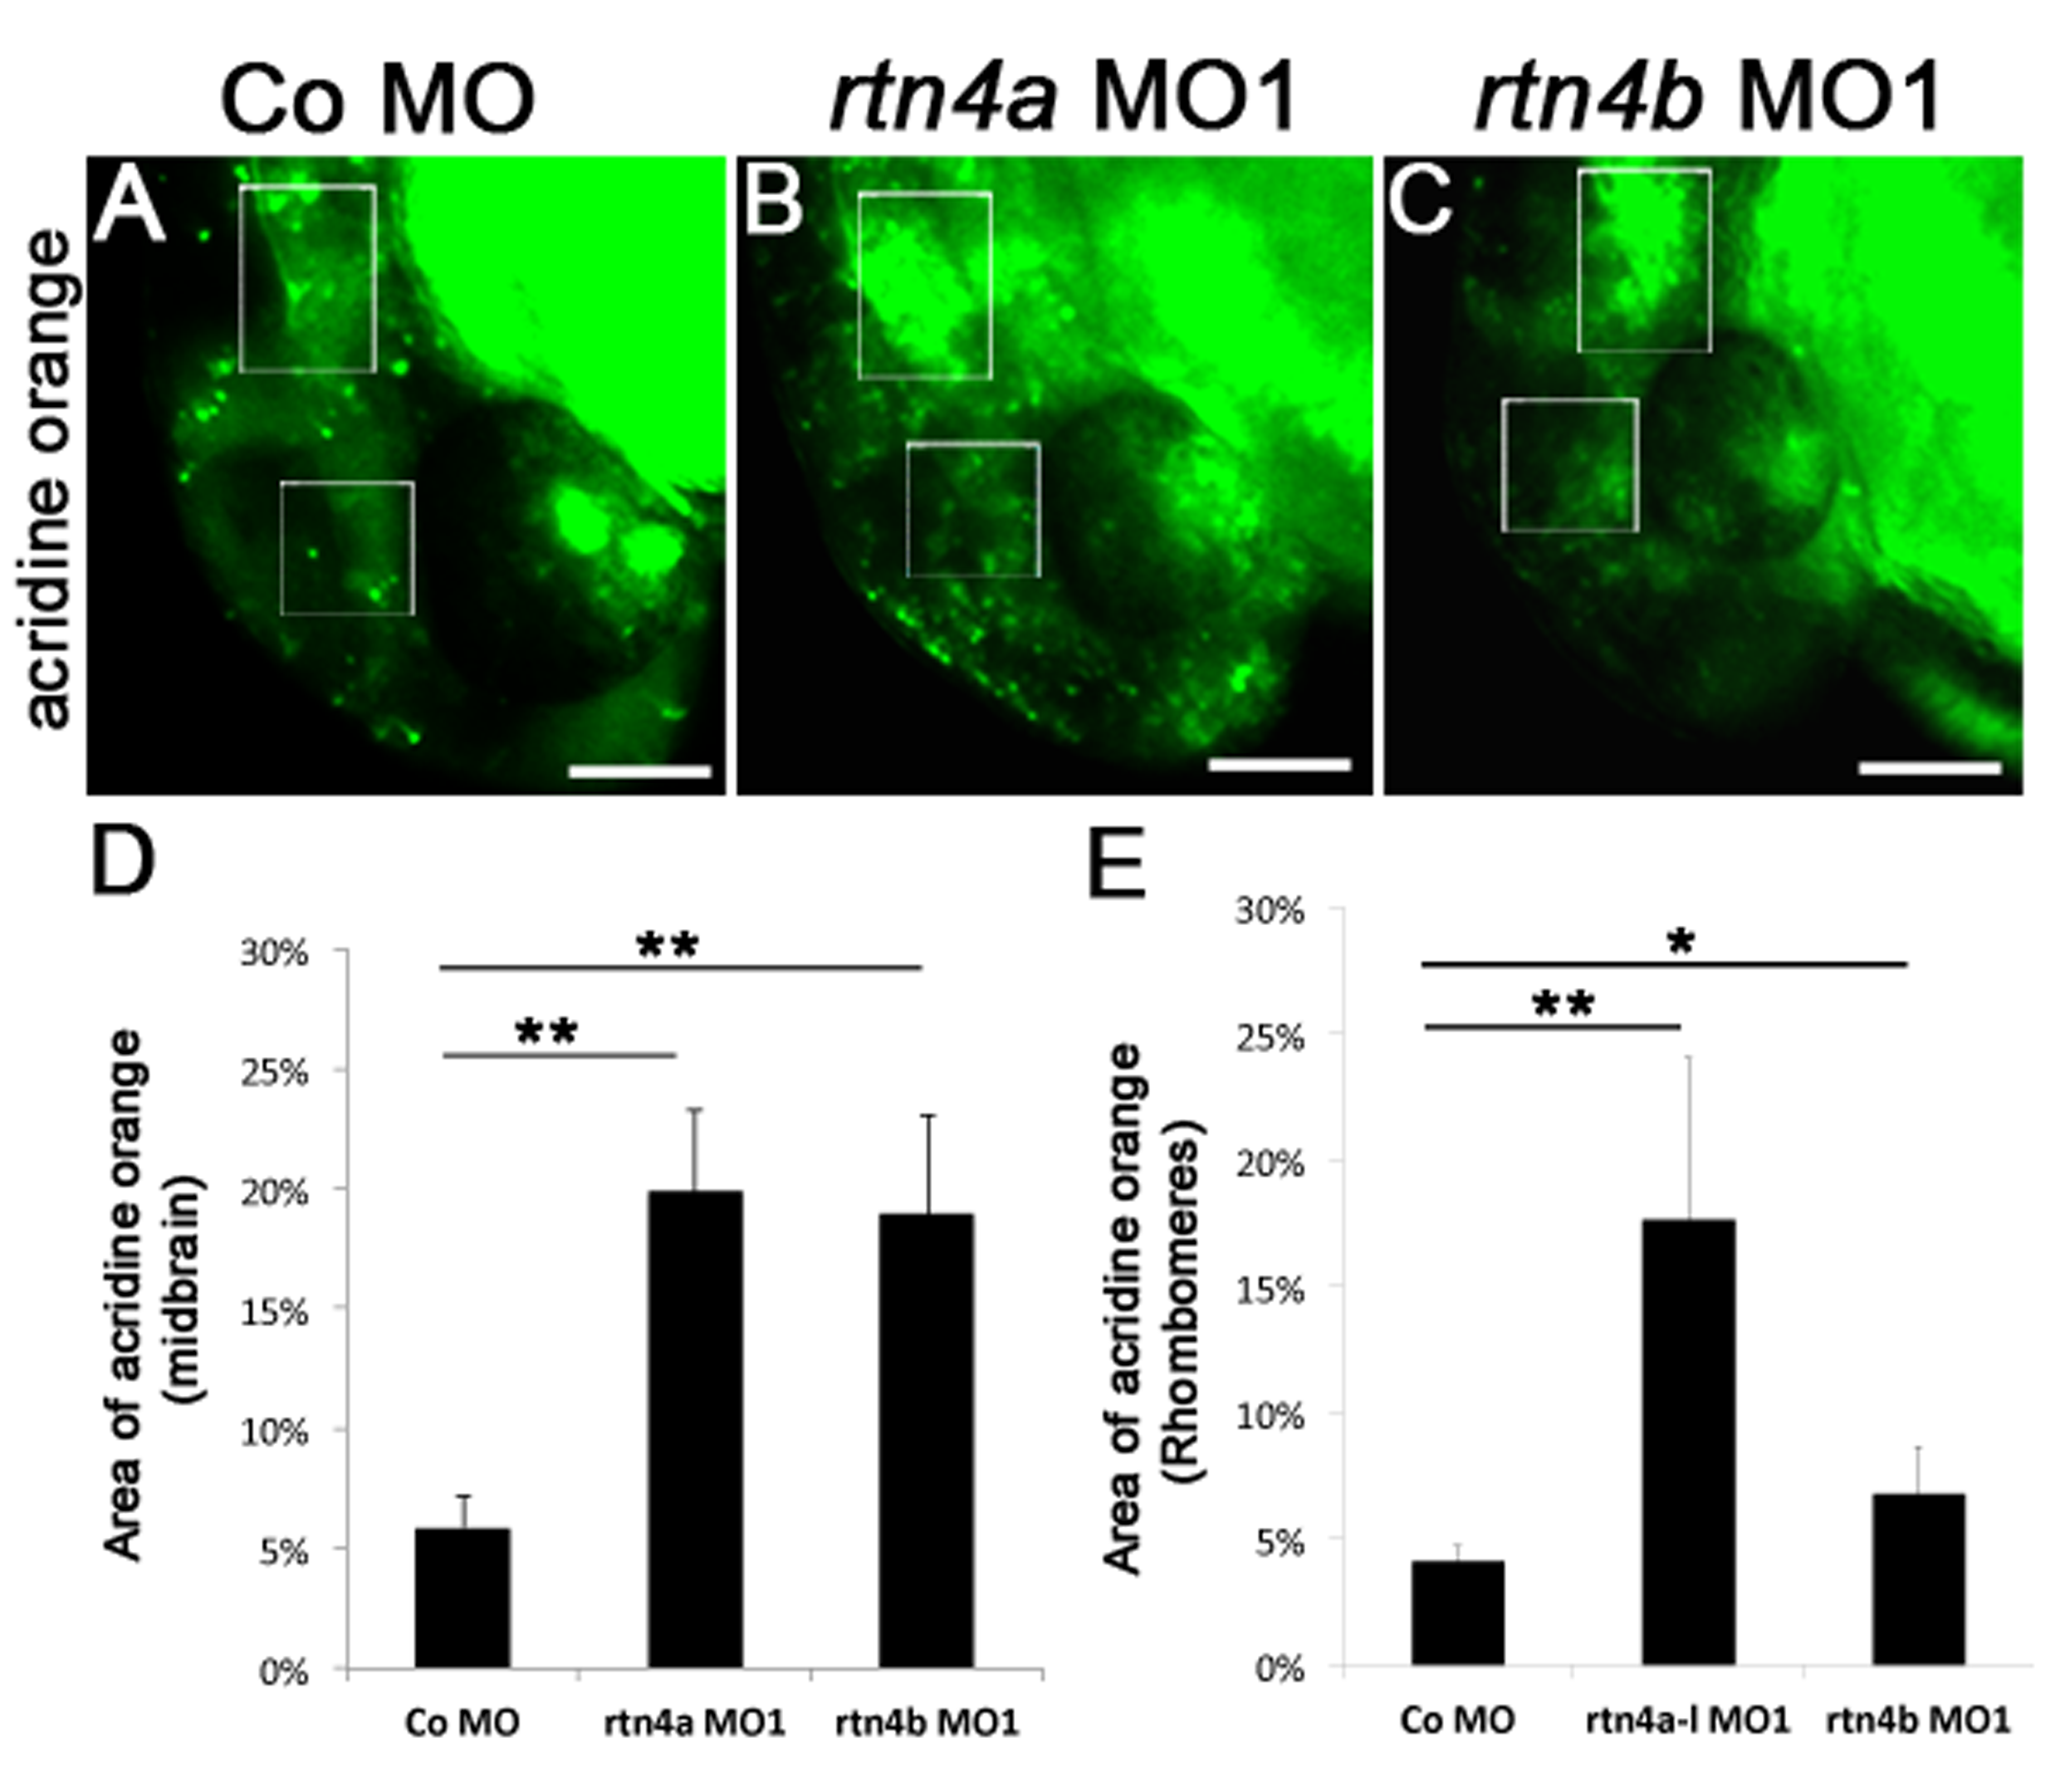
Fig. S4
Apoptosis in rtn4 morphant embryos. Comparison of apoptosis in control (A), rtn4a morphant (B) and rtn4b morphant (C). Cell death was visualized at 1 dpf by acridine orange staining. (D) and (E) Quantification of acridine orange intensity in selected areas of the midbrain (square) and hindbrain (rectangle) showing increased staining (arrow) in both morphants. Control MO (5.0 ng) (n = 30), rtn4a-l-MO1 (5.0 ng) (n = 25) and rtn4b-MO1 (5.0 ng) (n = 24).
Acknowledgments
This image is the copyrighted work of the attributed author or publisher, and
ZFIN has permission only to display this image to its users.
Additional permissions should be obtained from the applicable author or publisher of the image.
Full text @ Neural Dev.