
Fig. 2
- ID
- ZDB-IMAGE-140902-1
- Publication
- Al-Hamed et al., 2014 - Functional modelling of a novel mutation in BBS5
- All Figures
- Figures for Al-Hamed et al., 2014
|
Fig. 2
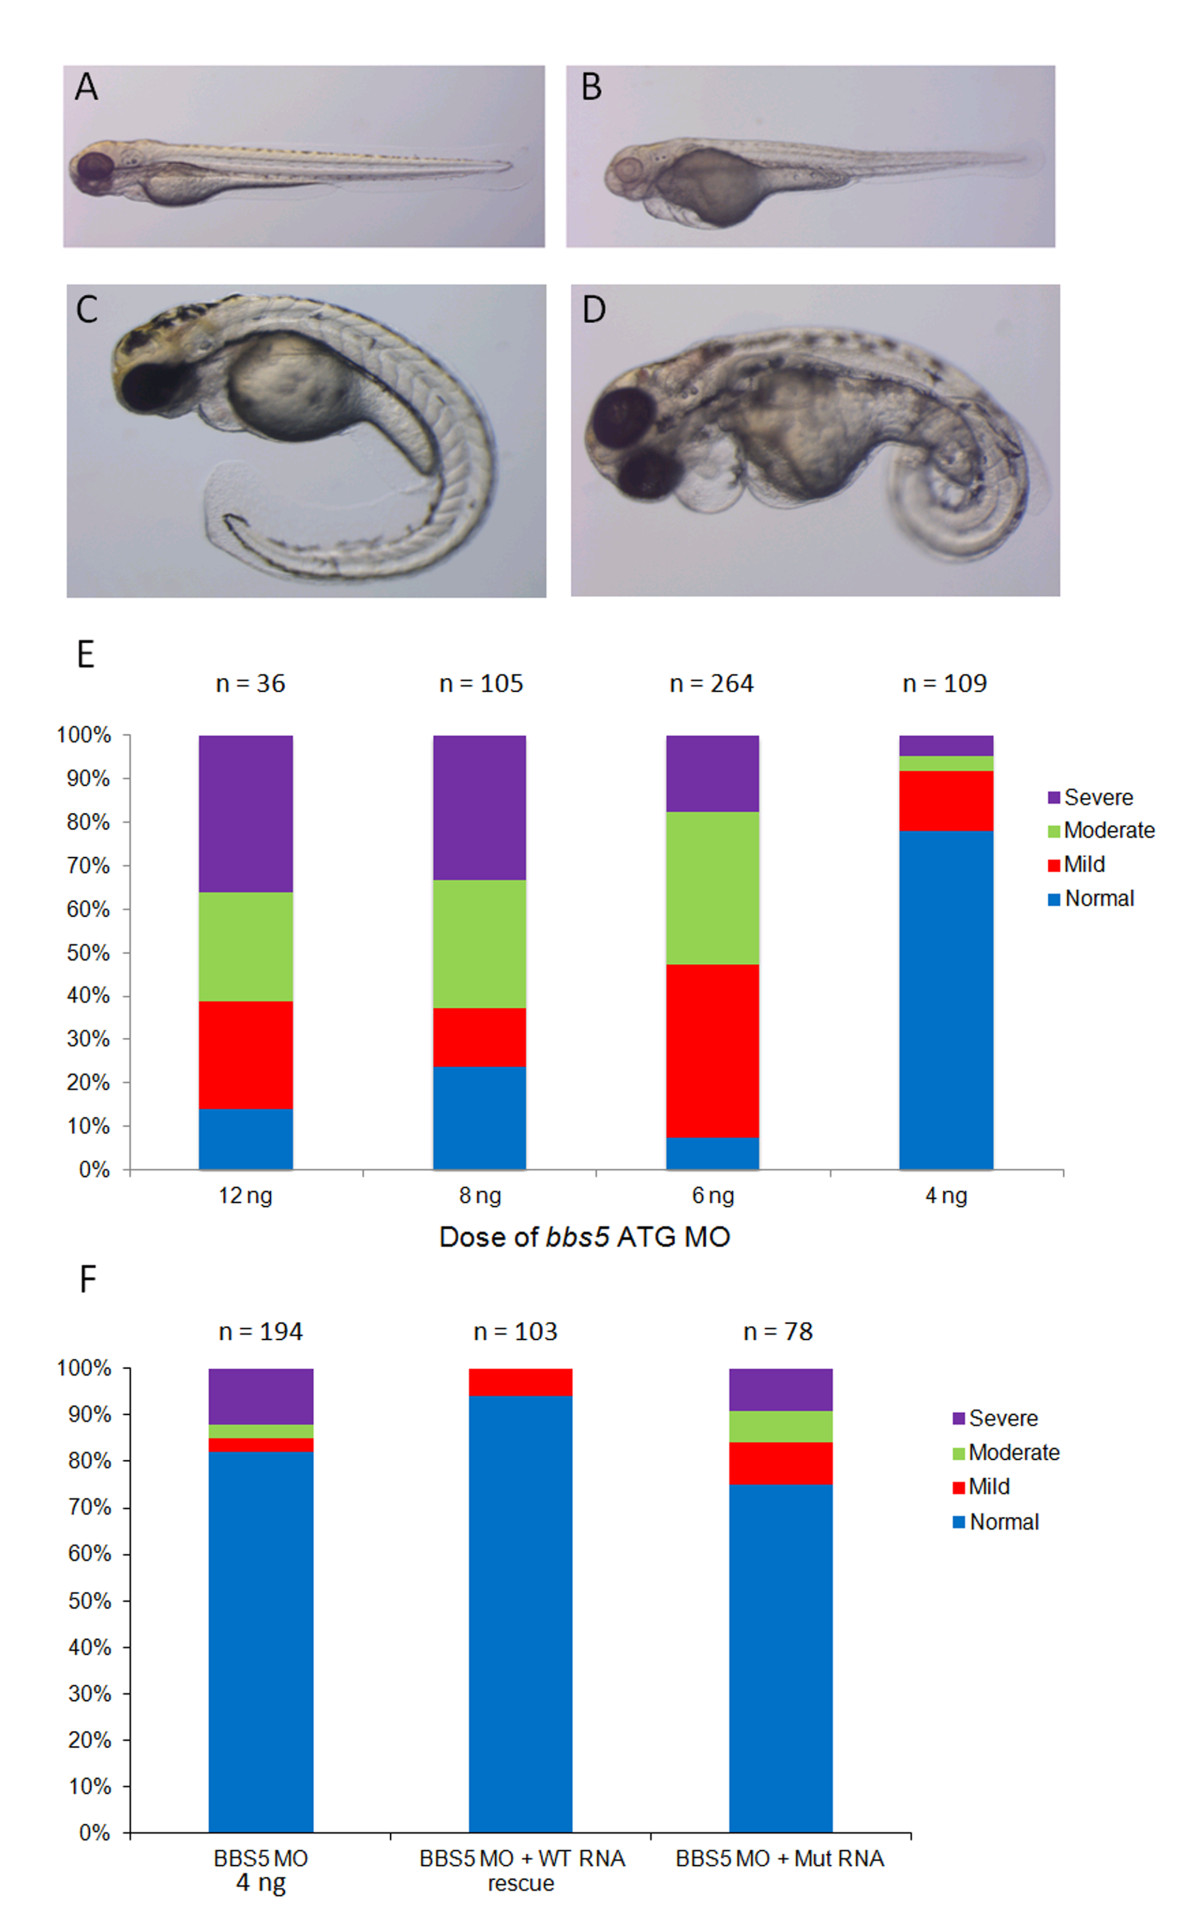
Phenotypic spectrum following bbs5 ATG MO injection and mRNA rescue. At 72 hpf following bbs5 MO injected (+/- mRNA rescue) zebrafish were phenotyped under light microscopy. Representative images are shown: (A) wildtype (WT) phenotype; (B) mildly affected morphant, showing a pericardial effusion and small eyes; (C) moderately affected morphant with a pericardial effusion, small eyes and a curly tail and (D) a severely affected morphant with a large pericardial effusion, small eyes and severe tail curvature. (E) Dose–response analysis of phenotypes following bbs5 ATG MO injection. Fish were classed phenotypically as normal if they were indistinguishable from uninjected fish; mildly affected if they had small eyes, mild pericardial effusion and mild/no tail defects; moderately affected if they had a large pericardial effusion and moderate tail defects, and severe if there was absent or very short malformed tail, widespread oedema, malformed eyes and minimal cardiac muscle contraction). Note a trend of increasing severity of phenotypes from 4 ng to 12 ng MO dose. The number of embryos (n) injected for each dose are shown. (F) Phenotypes of bbs5 ATG MO injected fish compared to co-injected WT BBS5 mRNA and mutant (Mut) BBS5 mRNA.