
|
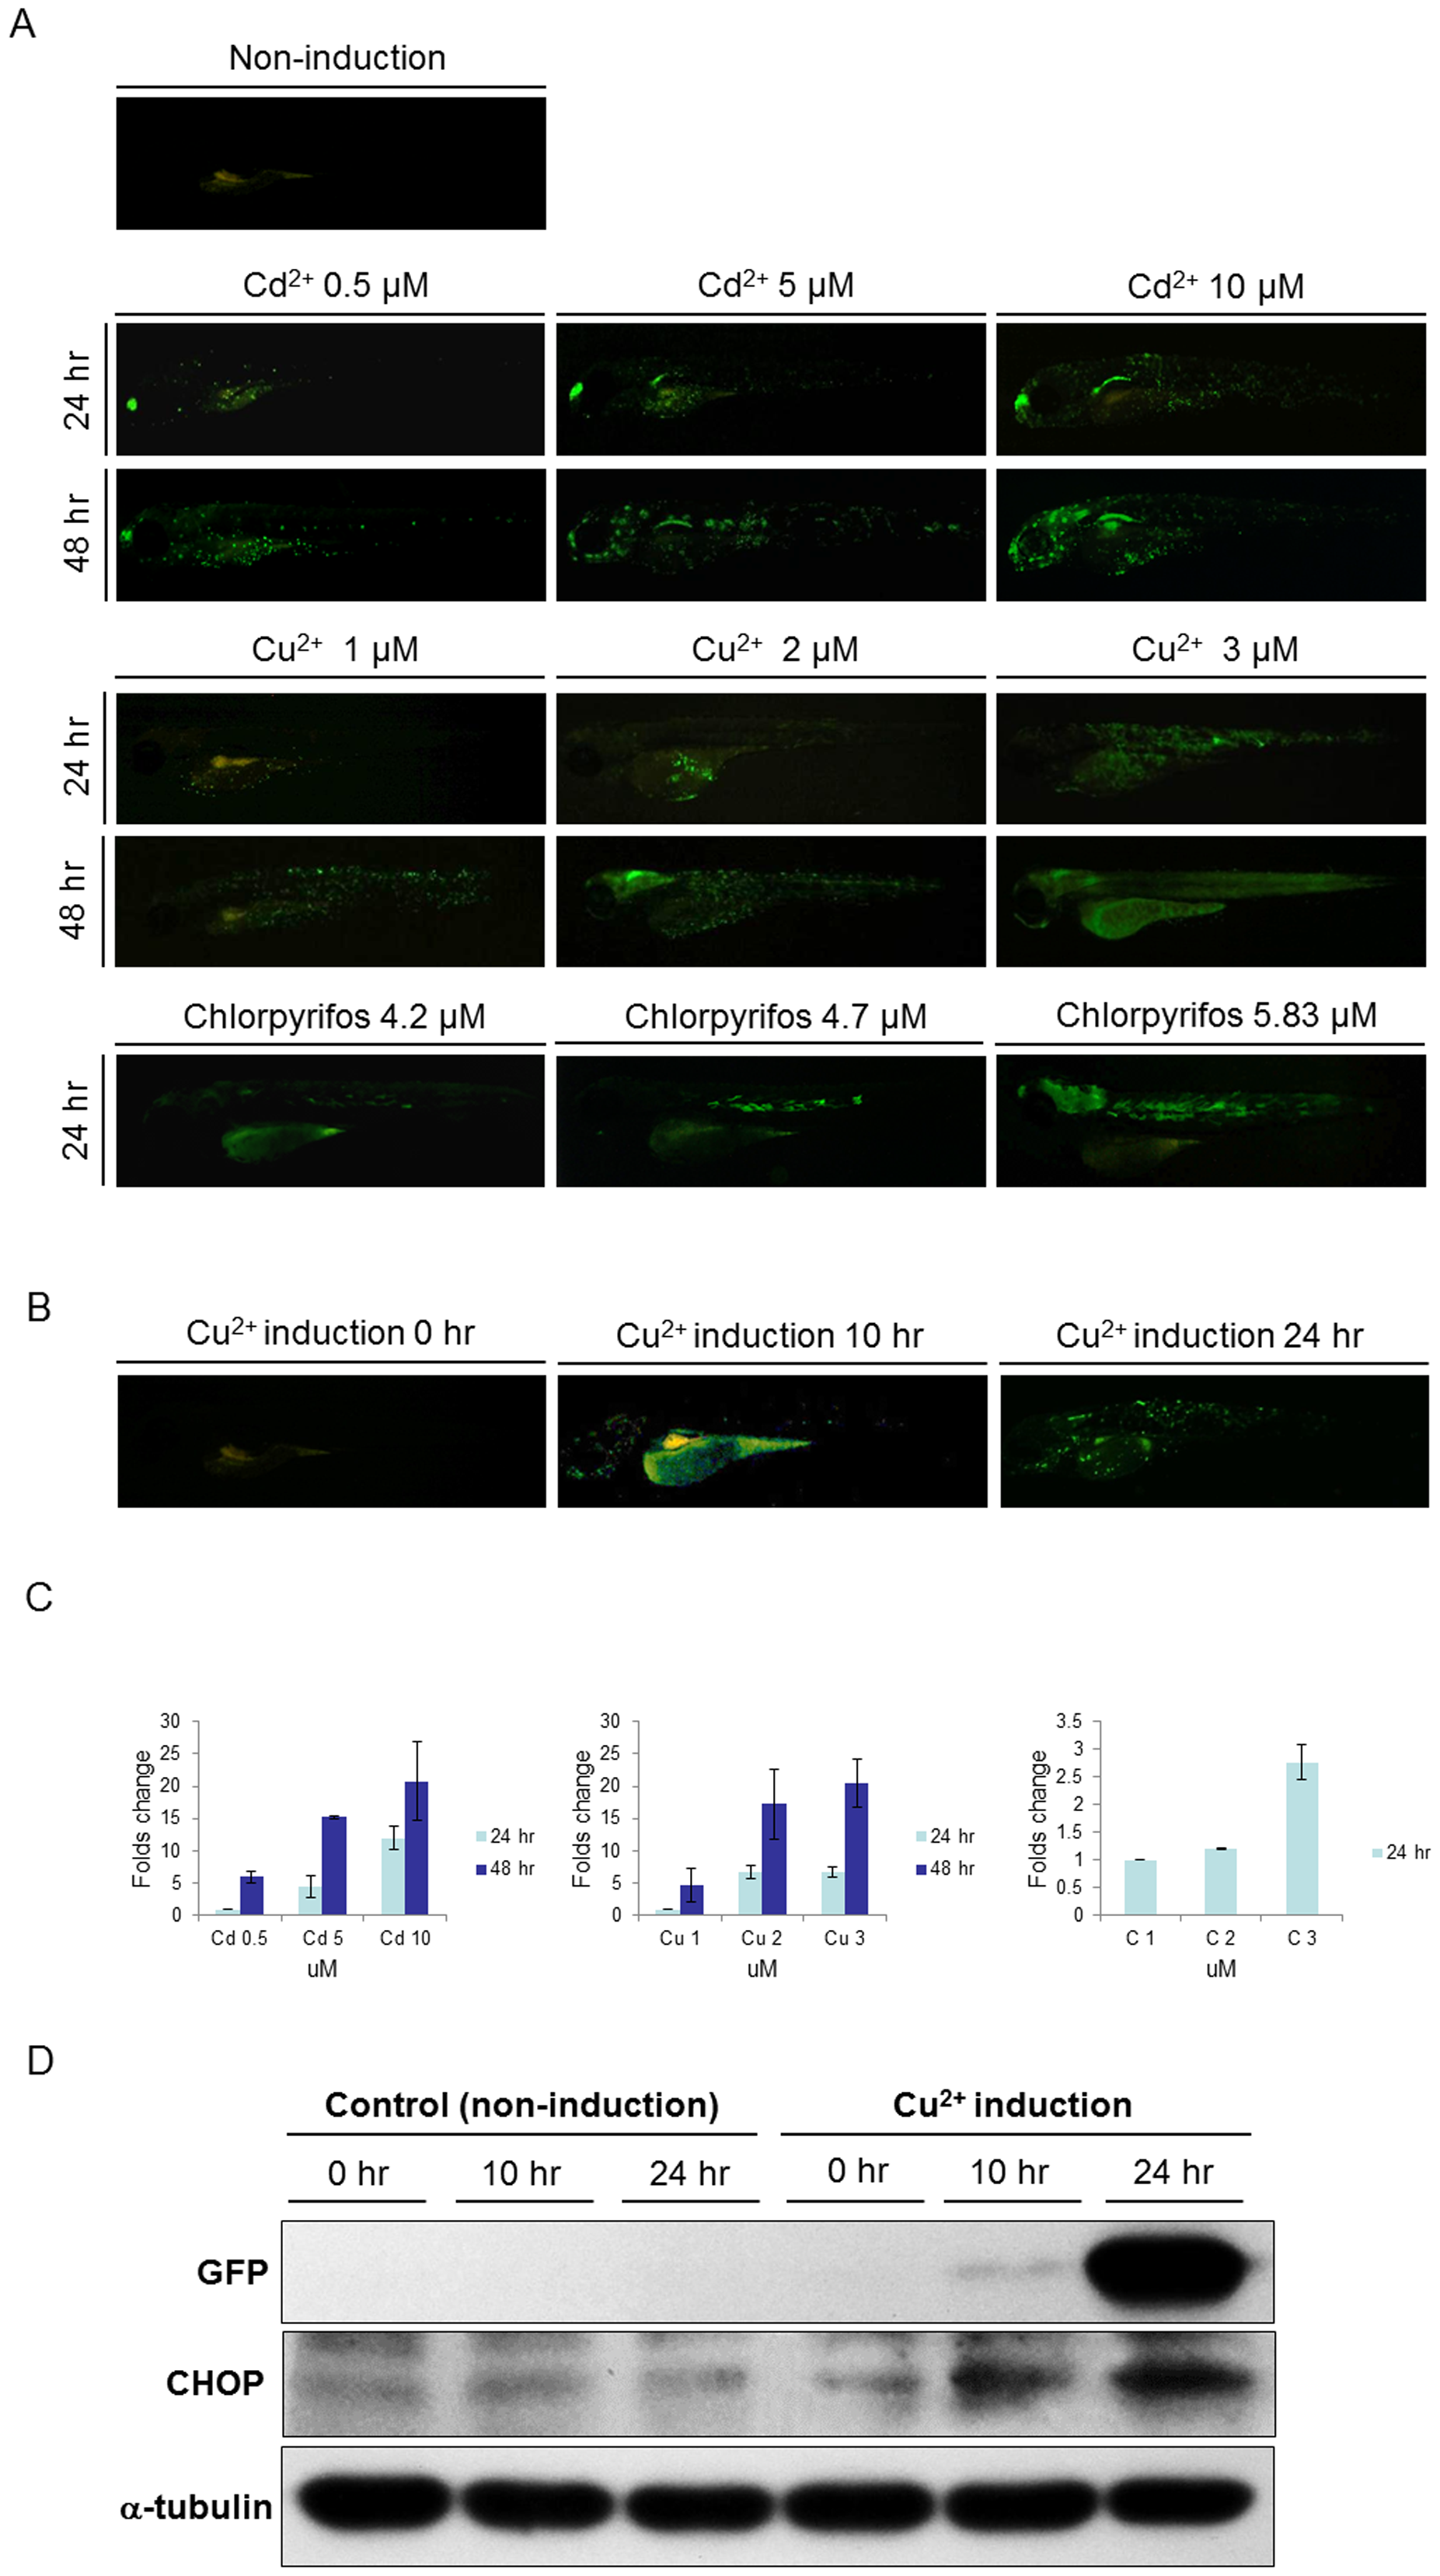
Fig. 2
The intensity of GFP signal was positively correlated with the strength of stress and the expression of endogenous Ddit3.
(A). At 72 hpf, huORFZ embryos were exposed to different concentrations of Cadmium (Cd2+), Copper (Cu2+), and chlorpyrifos, as indicated, and fluorescence signals were observed at 96 and 120 hpf. Mock group was treated with water containing DMSO which was added to the concentration representing the DMSO in the chlorpyrifos treatment group. As the chemical concentrations and incubation times increased, the GFP signals also increased. All images are lateral views with anterior to the left. (B). GFP expression patterns of huORFZ embryos after treatment with 0.1 mg/L (1.5 μM) of Cu2+ from 72 hpf for 10 hr and 24 hr, as indicated. All images are representative with the percentage among treatment groups labeled. All images are lateral views with anterior to the left. (C). The semi-quantification analysis based on fluorescent images. Both increased toxicant concentration and prolonged treatment time resulted in increased GFP signal intensity in huORFZ embryos. Note that the readings of each chemical treatment were normalized to the lowest dosage group of the same chemical. Thus, the signal values from different chemical treatments were not comparable. (D). The expression of endogenous Ddit3 in huORFZ embryos positively correlates to the signal strength of stress-induced GFP. Total cell lysates were prepared and analyzed by Western blot with specific antibodies to exogenous GFP and to the ER stress protein Ddit3. α-tubulin served as a loading control.