
|
Fig. 6
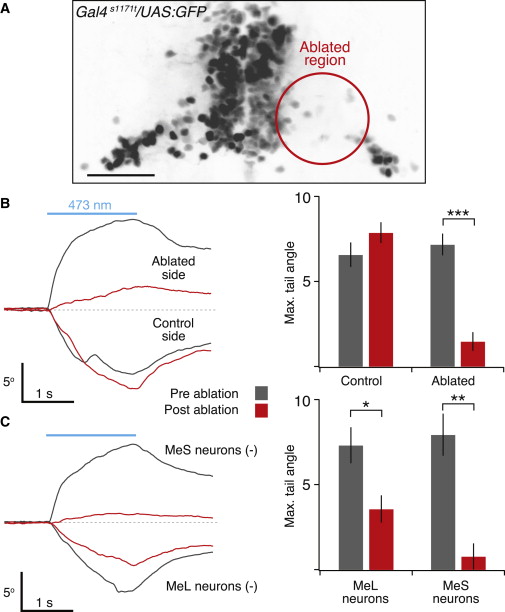
Contributions of MeL Neurons and MeS Neurons to Steering
(A) Two-photon image projection of the midbrain in a Gal4s1171t/UAS:GFP fish, in which the lateral region of the right nMLF was ablated 12 hr prior. Scale bar represents 50 μm.
(B) Left: tail angle as a function of time after stimulating left (bottom traces) and right (top traces) ChR2 sites before and after lateral right nMLF ablation. Right: reduction in tail angle is observed on the ablated side (n = 14, paired t test, p < 105; t(13) = 6.91), but not on the control side (n = 14, paired t test, p = 0.12; t(13) = 1.62). Blue line depicts the epoch of ChR2 stimulation.
(C) Left: tail angle as a function of time for left and right ChR2 stimulation sites before and after ablation of MeL neurons on the left side (bottom traces) and MeS on the right side (top traces). Right: reduction in tail angle is observed for MeL ablations (n = 7, paired t test, p < 0.02; t(6) = 3.49) and MeS ablations (n = 7, paired t test, p < 0.001; t(6) = 5.91). n values indicate number of fish. Error bars indicate SEM. Blue line depicts the epoch of ChR2 stimulation.