
|
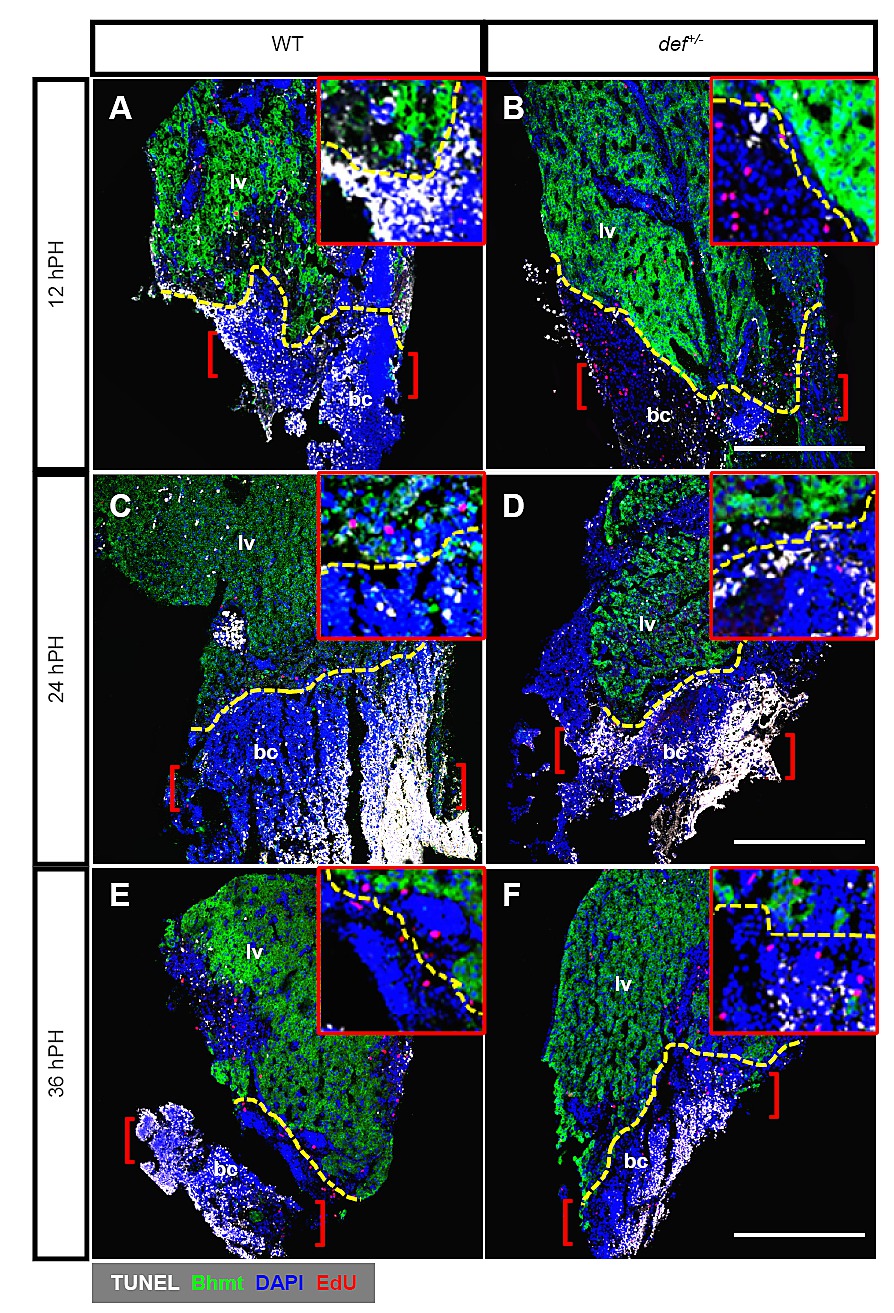
Fig. S3
Comparison of the wound healing process between the wild-type and def+/- livers after PH. Frontal plane sections of the liver 12, 24 and 36 h after PH were stained for apoptotic cells (in white, using the TUNEL assay), proliferative cells (in red, by EdU incorporation) together with Bhmt (hepatocyte marker) (in green). DAPI was used to stain the nuclei (blue). All images show the part of the hepatic tissue adjacent to the amputation site. Yellow dashed lines outline the amputation site, while regions defined by red brackets represent the blood clot. (A–D) The blood clot was clearly formed in both the wild-type (A) and def+/- mutant (B) fish 12 h after PH. Cells in the blood clot underwent massive apoptosis 24 h after PH (C,D). (E,F) By 36 h after PH, the blood clot was detached from the liver mass in the wild-type fish (E), whereas it was still connected to the liver mass in the def+/- mutant (F). The inset, enlarged view corresponds to the amputation site (A–F). bc, blood clot; lv, liver tissue. Scale bar: 250 μm (A–F).