
|
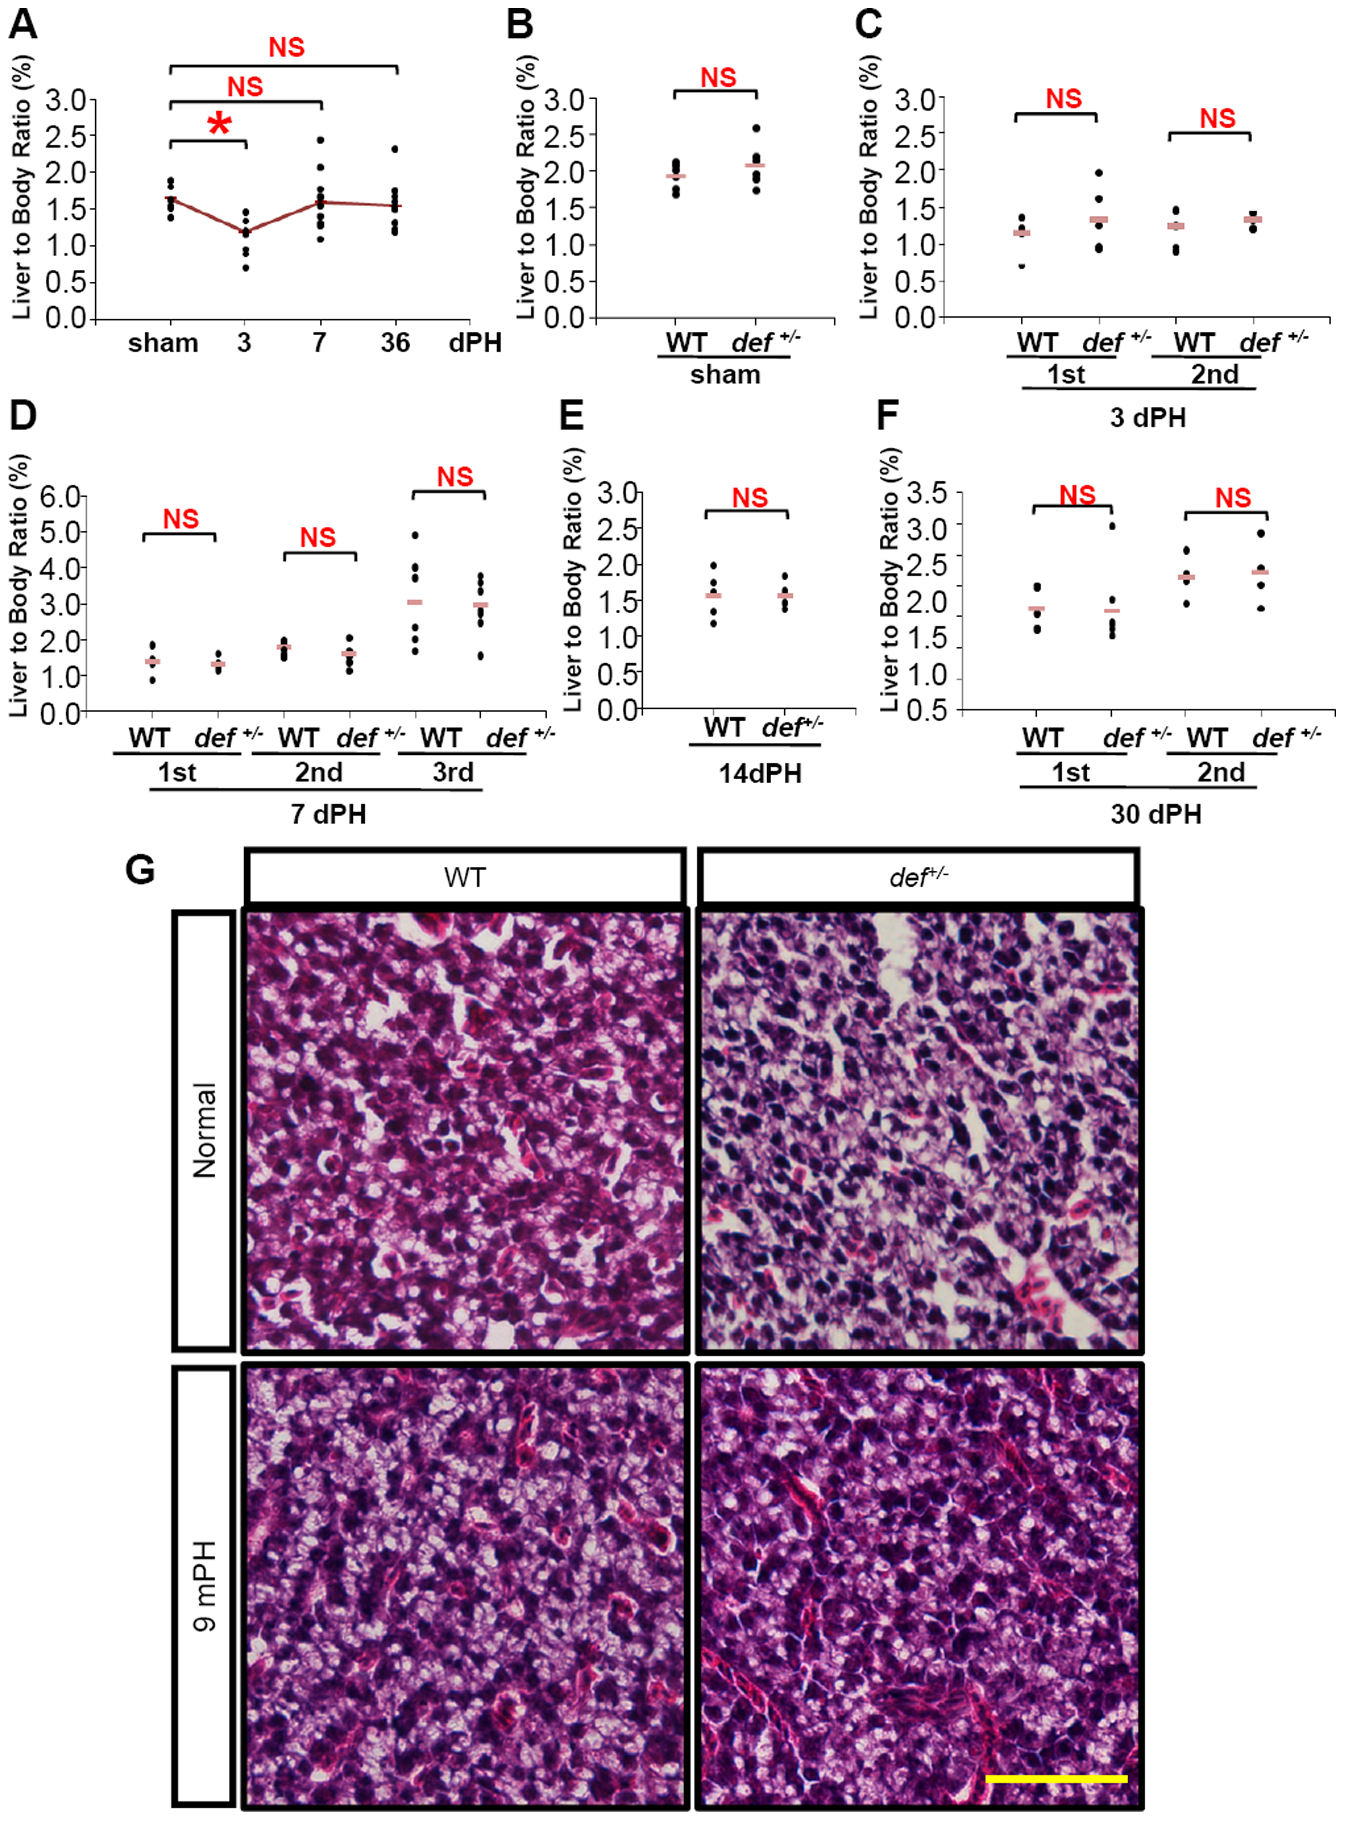
Fig. 2
The liver-to-body ratio of the regenerated livers did not differ significantly between the wild-type and def+/- mutant fish after PH.
(A) Liver-to-body ratio of the wild-type sham control and amputated wild-type liver at 3, 7 and 36 days after PH (ne5). (B) Liver-to-body ratios of the sham controls (n≥5) for the wild-type and def+/- mutant fish. (C–F) Comparison of the liver-to-body ratios of the amputated wild-type and def+/- livers 3 days after PH (C), 7 days after PH (D), 14 days after PH (E) and 30 days after PH (F) as indicated (n≥5 in each case). NS: not significant; *: p<0.05. (G) Representative images of haematoxylin-eosin staining of sections across the wild-type or def+/- hepatic parenchyma without performing PH or 9 months after PH. Scale bar: 50 μm.