
Image
|
Figure Caption
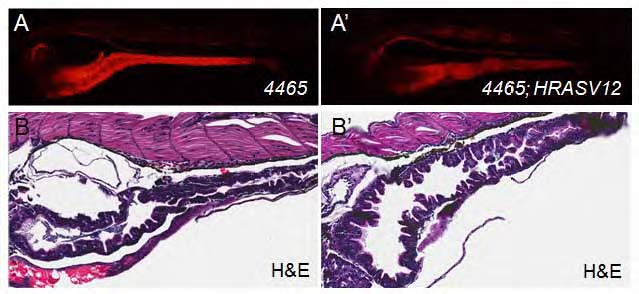
Fig. S1 (A) Gross morphology of Tg(mu4465_13:Gal4,UAS:mCherry) using fluorescent microscopy. mCherry is expressed in the gut, kidney, and notochord. (B) H&E staining. (A′, B′) Same as in (A-B), but double transgenic 4465:Gal4;UAS:HRASV12.
Acknowledgments
This image is the copyrighted work of the attributed author or publisher, and
ZFIN has permission only to display this image to its users.
Additional permissions should be obtained from the applicable author or publisher of the image.
Full text @ Dis. Model. Mech.