
|
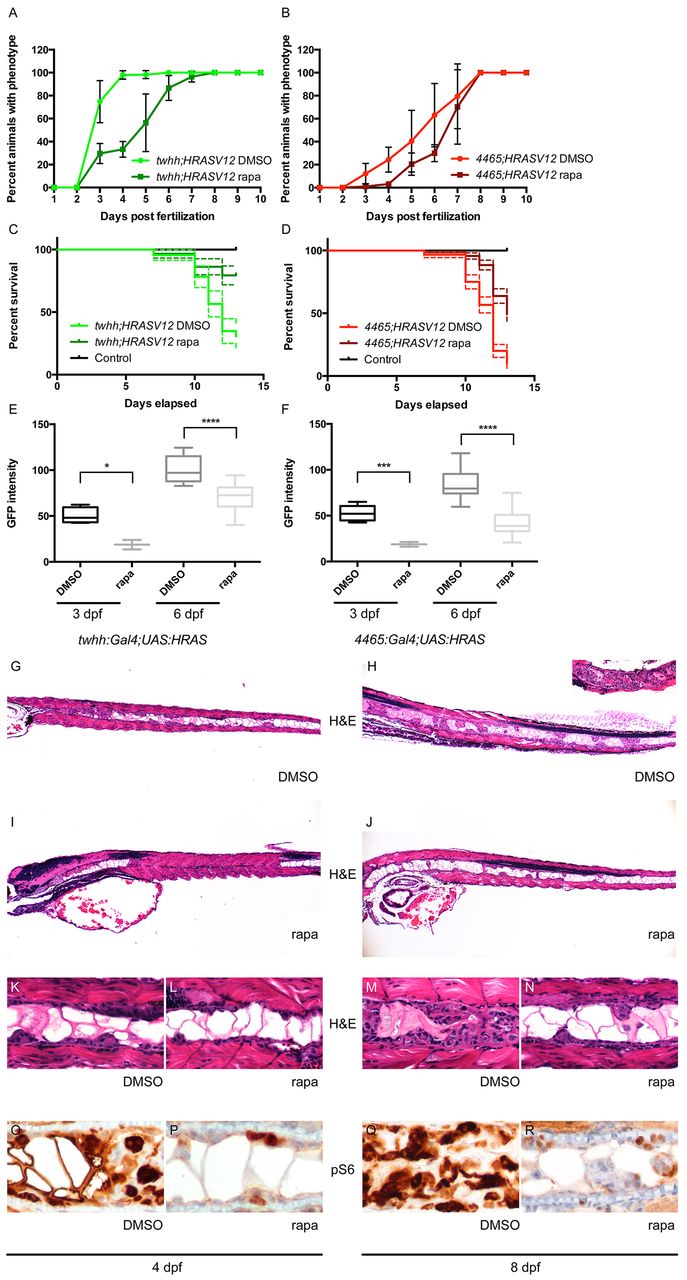
Fig. 3 Rapamycin inhibits notochord tumor progression. (A,B) Rapamycin treatment delayed the onset of the zebrafish notochord tumor in both twhh:Gal4;UAS:HRASV12 (A) and 4465:Gal4;UAS:HRASV12 (B) fish. (C,D) The delayed onset of the phenotype correlated with a better survival of rapamycin-treated animals compared with DMSO-treated controls [twhh:Gal4;UAS:HRASV12 (C), P<0.0001 and 4465:Gal4;UAS:HRASV12 (D), P<0.0001]. The dashed lines represent 95% confidence intervals. (E,F) Simple measurement of average GFP intensity in the proximal notochord showed a significant difference between DMSO- and rapamycin-treated twhh:Gal4;UAS:HRASV12 (E) and 4465:Gal4;UAS:HRASV12 (F) zebrafish at 3 and 6 dpf. *P=0.0281; ***P=0.006; ****Pd0.0001. (G–N) The decrease in average GFP intensity was presumably due to reduced tumor growth as shown by H&E staining. (G,K) At 4 dpf, twhh:Gal4;UAS:HRASV12 transgenic embryos already showed a significant tumor formation presenting as solid growth anteriorly and as a more nested growth posteriorly. (I,L) Rapamycin-treated embryos showed only minimal tumor formation at 4 dpf, even anteriorly. (H,M) At 8 dpf, the tumor growth progressed compared with at 4 dpf, and variably involved the entire length of the notochord with severe involvement of the anterior notochord (inset in H), whereas rapamycin-treated embryos showed a much milder, predominantly nested pattern of growth (J,N). Immunohistochemistry showed a focal, but less intense, staining for pS6 in rapamycin-treated animals (P,R) compared with DMSO-treated controls (O,Q).